Store reports
Reports
Store reports are pre-configured reports with added filtering options. All store reports open in a browser. They can be printed immediately or saved to a file location. In reports where GP% is available, a free text value parameter is included to highlight GP%.
- From
 , navigate to Activity and click Reports.
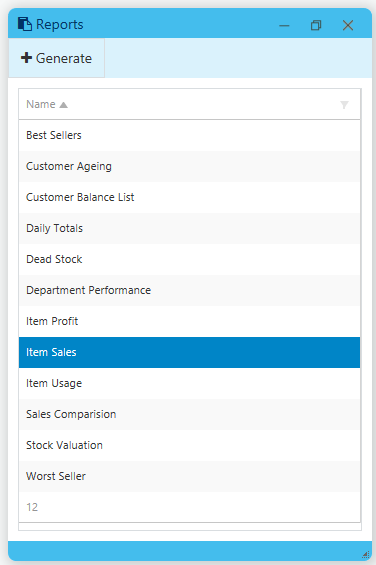
 - In the Reports window, select a report, then click Generate.

You may be prompted to login to the Report server.
Additional filters and options can be selected from the report interface. See Store reports
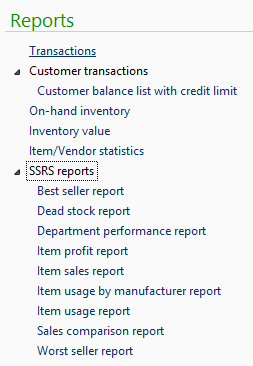
The SSRS reports can also be accessed from the Reports group on the Fred NXT Head Office dashboard:

The Best sellers report displays a list of the top 1000 products based on Qty sold for the selected date range.
The report output is grouped either by Store or by Item. Products are sorted in descending order by Qty sold.
By default, Parace is set in Search Product to reduce the size of the initial data set.
- Grouped by store: sort store alphabetically then sort products by quantity sold in the store.
- Grouped by item: sort products by quantity sold in stores selected then stores alphabetically.
- Show <quantity sold in each store + Item total>
Filter defaults
- Start date defaults to current date minus 1 year
- End date default to the current date
- All zones are selected
- All Classifications are selected
- All Level 02 are selected
- No stores are selected
- Preferred vendor is set to Any supplier (i.e. All)
- Group by must be selected.
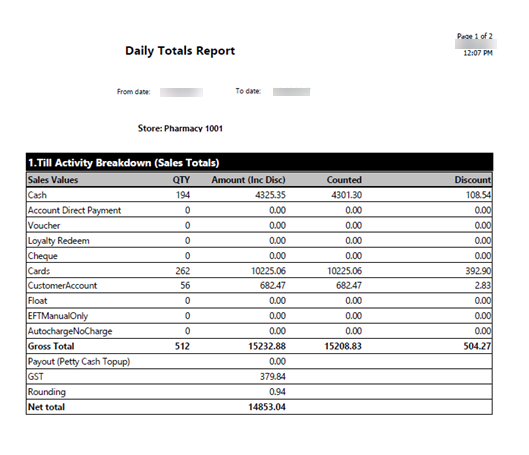
The purpose of the Daily totals report is to allow the user to reconcile their banking totals for the day.
The values on the report match the values from the shifts that were closed on the dates selected in the report filters.
For example, If the store closed their shifts for the day at 5pm and then continued to trade until 8pm, the transactions performed after the shifts had been closed will be included in the next day’s report, when those next shifts have been closed.
This reports consolidates three main areas of reporting:
- Till Activity Breakdown
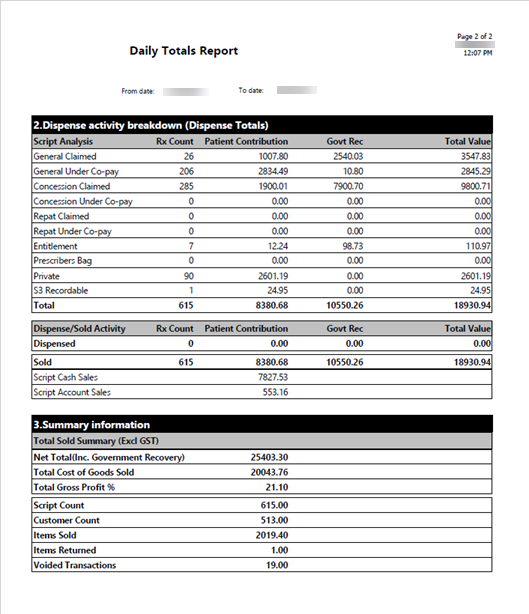
- Dispense Activity Breakdown
- Summary Information
Each section includes a Total. The Daily Totals report runs on multiple pages. It can be exported to .csv, to facilitate its import into other accounting systems.
The Total Sales reports is a re-designed version of the Daily Totals report.
It displays sales activity across all POS and all shifts, based on the transaction date.
It is divided in three sections:
Section 1 displays sales totals by tender type for the selected date(s).
The Discount Total in this section excludes all Promotional discounts. It displays only the total of manual discounts performed at POS.
Section 2 displays script information for scripts sold at the POS for the selected date(s).
Section 3 displays the Sales total.
The Daily Totals report is still available. It present similar data broken down by shifts.
The Dead Stock report displays details of products that have not been sold in the last 365 days.
- This date range can be changed in the Visual level filters using the ‘DaysSinceLatestSale’ filter. Ie. This is set per visual, not at the report level.
- The user may also wish to filter out new lines by using the ‘CreatedDateTime’ Visual level filter – this will be defaulted to ‘before 1 January 2017’ for release. User will have to change this manually as they move forward.
- Dead Stock report is defaulted to display only those items with a SOH that does not equal zero.
- User can drill down to Product level if required.
- User can also filter by Vendor or Store using the slicer on the page.
Filters
Visual Level filters
- CreatedDateTime (to exclude ‘new’ items)
- DaysSinceLatestSale (to define ‘dead’ stock)
Report level filters
- Calendar Date
- Financial Year Description
- Level02
- Level03
- Product Name
- State
- Store name
- Vendor name
The Department performance report displays product sales summarised at a department or category level for a selected date range.
The report output is grouped by department with a department total at the top of the grid, and then details individual category totals within that Department.
Filter defaults
- Start date – defaults to the first st day of current month
- End date – defaults to current date
- Stores – all selected
- Level 03 – disabled until Department selected
- Classification – all selected
- Zone – all selected
- Level 02– User must select
The Item profit report displays a list of products sold for the selected date range with profit details.
The report output is grouped either by Store or by Item.
By default, Parace is set in Search Product to reduce the size of the initial data set.
- Grouped by store: sort store alphabetically, then sort department/category alphabetically and products alphabetically,
- Grouped by product: department/category alphabetically and products alphabetically, then stores alphabetically.
- Show <quantity sold in each store + Item total>
Filter defaults
- Preset date – User must select from Last Week, Last Month, Last 3 Months, Last 6 Months, Year to Date or Select Date Range.
- Start date – defaults to Start date of Preset date range if selected. Otherwise user may select Start date.
- End date – defaults to End date of Preset date range if selected. Otherwise user may select End date.
- Zone – all selected
- Store – all selected
- Classification – all selected
- Level 02 – all selected
- Preferred supplier – Any supplier
- Group by – User must select.
- Highlight GP% - User can enter a numerical value.
The Item sales report displays a list of products sold for the selected date range.
The report output is grouped either by Store or by Item.
By default, Parace is set in Search Product to reduce the size of the initial data set.
- Grouped by store: sort store alphabetically then sort Level 02 and 03 alphabetically and products alphabetically
- Grouped by product: Level 02 and 03 alphabetically and products alphabetically, then stores alphabetically.
- Show <quantity sold in each store + Item total>
Filter defaults
- Classification – all selected
- Zone – all selected
- Stores – all selected
- Department – all selected
- Preferred supplier – Any supplier
- Group by – User must select
From release 06 2017, the Item Usage by Manufacturer report has been removed from the Store reports. To generate this report, access the Item Usage report and set the filter to Manufacturer.
The Item usage report displays a list of products sold for the selected date range.
The report output is grouped either by Store or by Item.
- Grouped by store: sort store alphabetically, then sort department/category alphabetically and products alphabetically.
- Grouped by product: department/category alphabetically and products alphabetically, then stores alphabetically.
- Show quantity sold in each store + Item total
Filter defaults
- Classification – all selected
- Zones – all selected
- Stores – all selected
- Level 02– all selected
- Preferred supplier – Any supplier
- Group by – user must select
The Sales comparison report displays a list of products sold for multiple selected date ranges, allowing the user to compare the different periods.
The report output is grouped by department/category and then by Item.
Filter defaults
- Range 1 Start date – User must select
- Range 1 End date – User must select
- Range 2 Start date – User must select
- Range 2 End date – User must select
- Stores – User must select
- Classification – all selected
- Level 02 – all selected
- Zones – all selected
- Preferred supplier – Any supplier
The Stock valuation report displays a list of products and their associated stock value.
Filter defaults
- Classification – all selected
- Zones – all selected
- Stores – all selected
- Level 02 – all selected
- Category – all selected
- Preferred supplier – Any supplier
- Only show items with stock – User must select.
The Worst sellers report displays a list of the bottom 1000 products for the selected date range.
The report output is grouped either by Store or by Item. Products are sorted in ascending order by Qty sold.
By default, Parace is set in Search Product to reduce the size of the initial data set.
- Grouped by store: sort store alphabetically then sort products by quantity sold in the store.
- Grouped by product: sort products by quantity sold in stores selected then stores alphabetically.
- Show <quantity sold in each store + Item total>
Filter defaults
- Start date defaults to current date minus 1 year
- End date default to the current date
- All zones are selected
- All Classifications are selected
- All Level 02 are selected
- No stores are selected
- Preferred vendor is set to Any supplier (i.e. All)
- Group by must be selected


 Fred Learning Pathways