Sales
Reports
Sales reports - Head Office
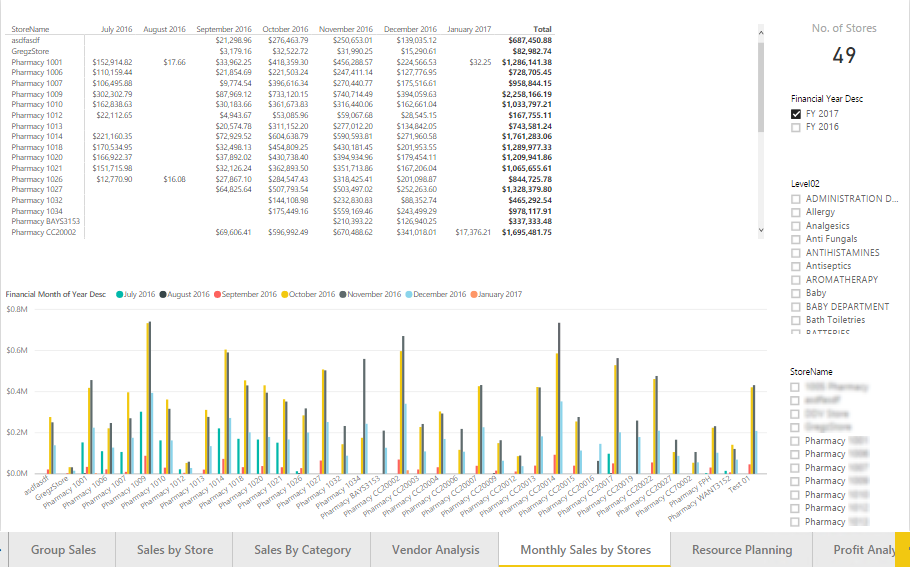
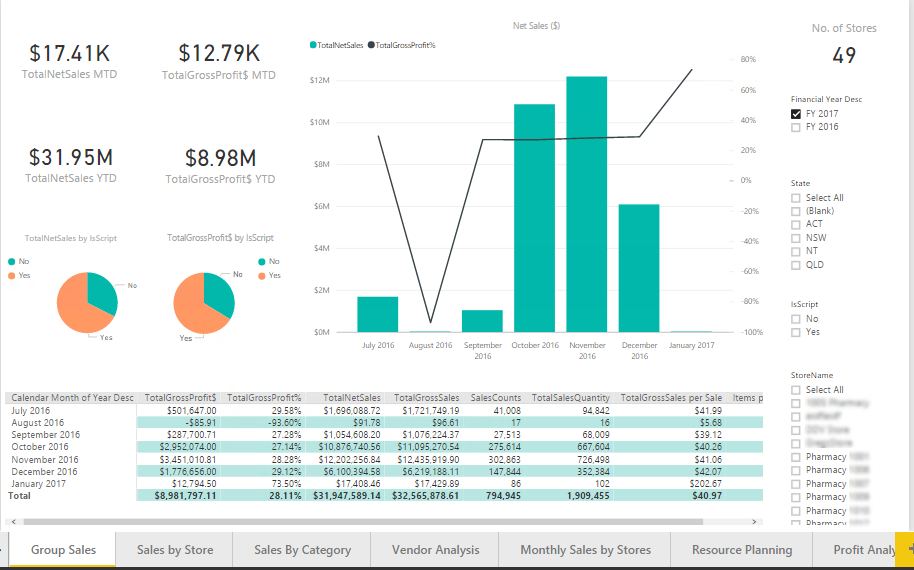
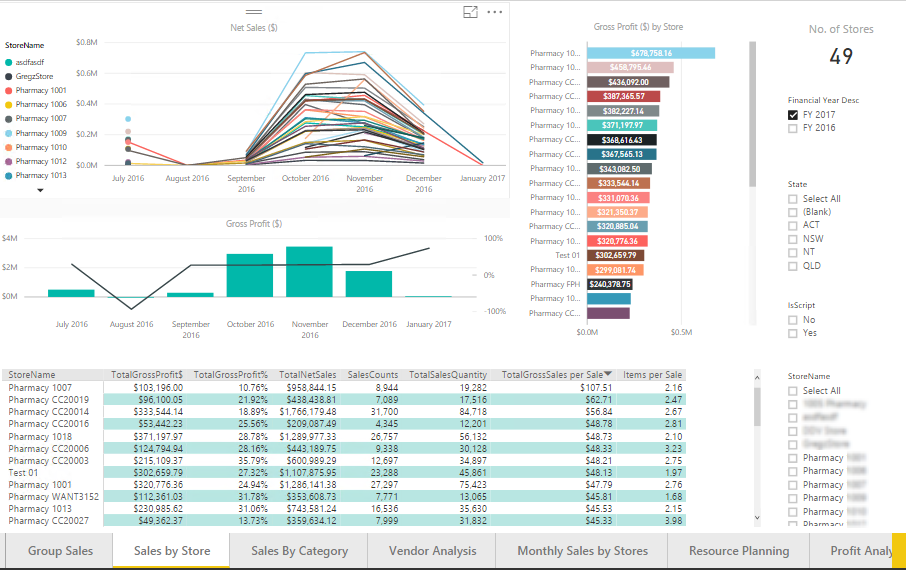
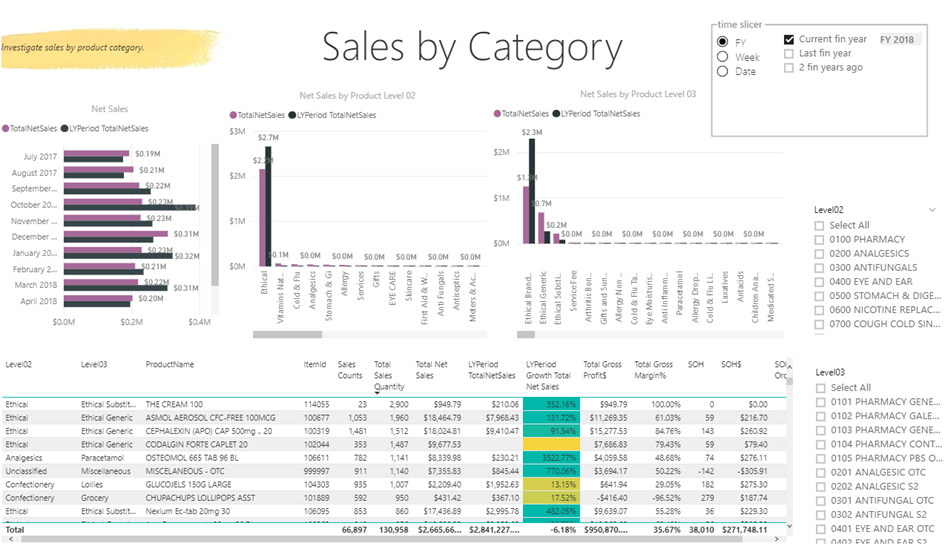
- View the TotalNetSales per month for all or selected Stores in the group.
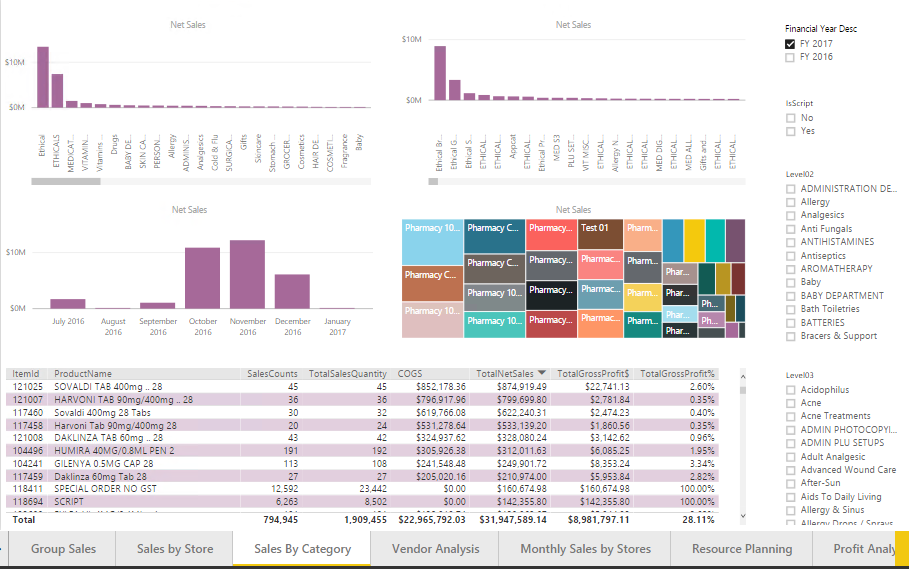
- User can also slice by Store name or Level02.
Filters
The following filters are available in both Head Office and Store versions of the Monthly Sales by Store Report:
- Calendar Date
- Financial Year Description
- Level02
- Level03
- Product Name
- State
- Store name
- Vendor name
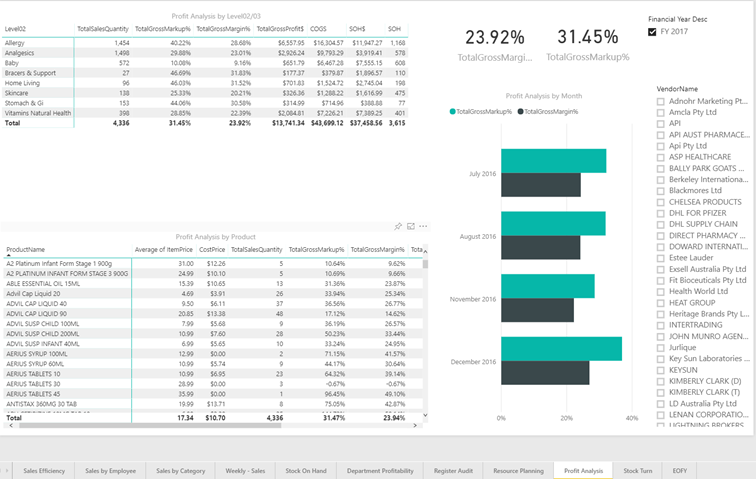
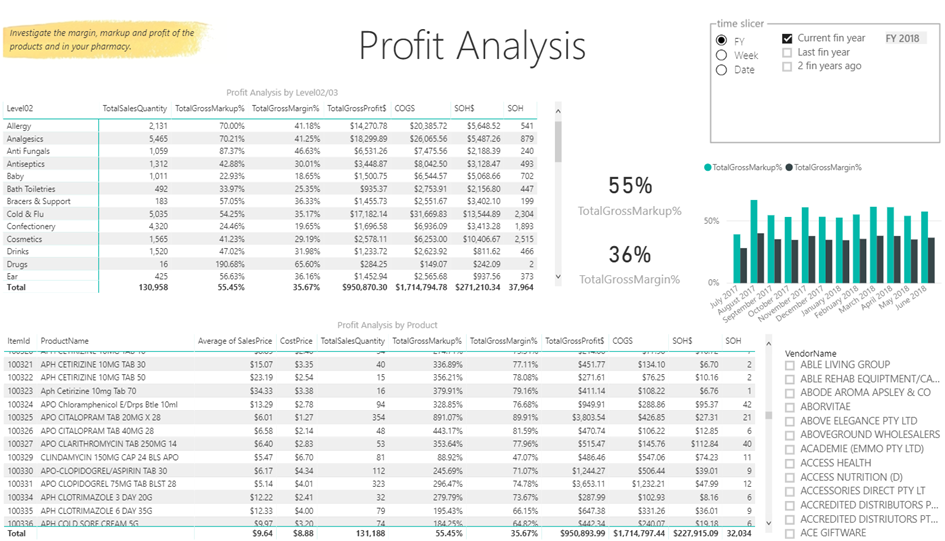
The Profit Analysis Report allows the user to view details of their TotalGrossMargin% and TotalGrossMarkup% across different hierarchy levels.
- Filter the reports using the Is Script slicer
Measures
- ItemPrice – current Sell price
- CostPrice – current calculated Cost price
- TotalGrossMargin% calculation = GP$ / ItemPrice
- TotalGrossMarkup% calculation = GP$ / COGS
Available Filters
- Calendar Date
- Financial Year Description
- Level02
- Level03
- Product Name
- State
- Store name
- Vendor name
Sales reports - Store
The Department profitability report allow you to compare the profitability and sales volumes of your product departments.
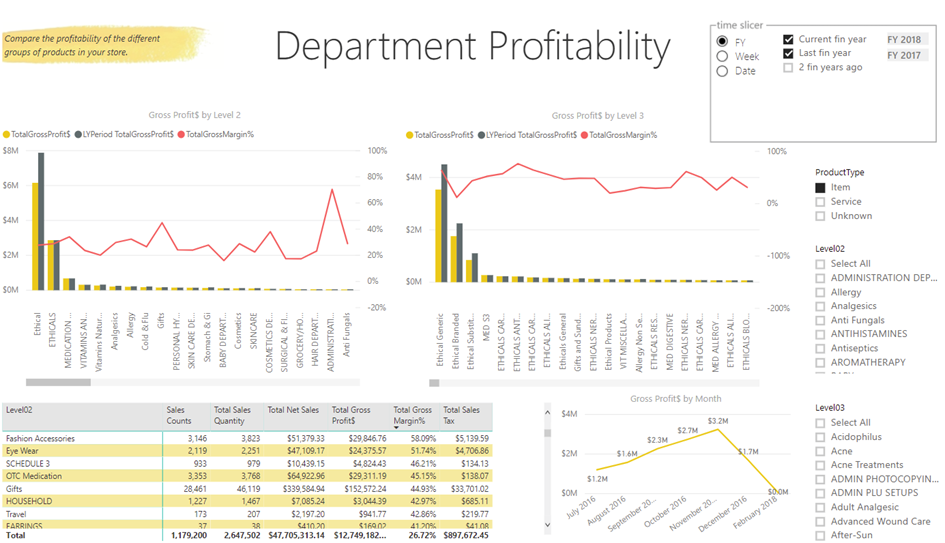
The table can be sorted, so that you can view department performance across a range of measures such as TotalSalesQuantity and TotalNetSales.
Additional filters are available on the side of the page.
The Register audit report allows the user to view cashiers’ activities at POS. For example, sales, suspended sales, returns, credits, discounts and account payments.
The report also displays a daily trend for such activities. The page can be filtered to a particular FY, month or POS terminal.
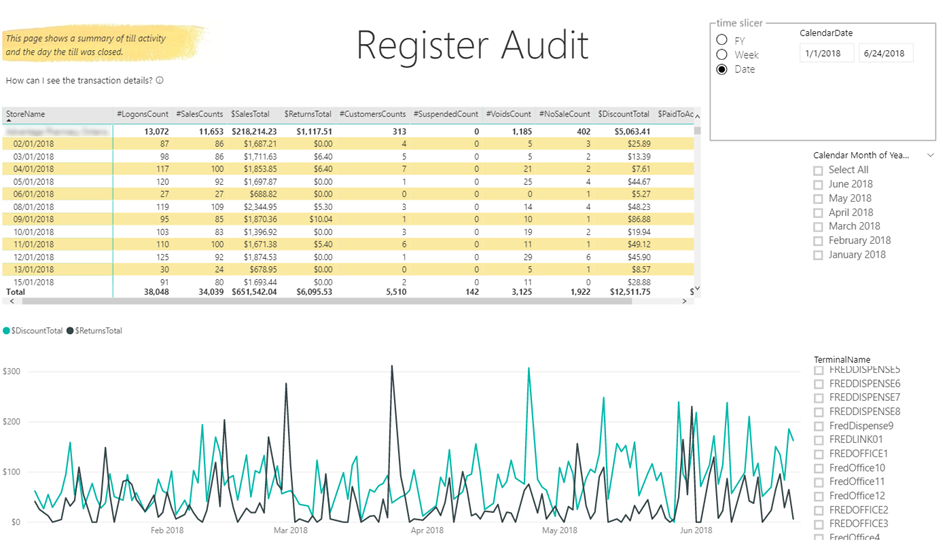
The Register Audit provides additional data granularity and allows users to drill through to transaction level details.
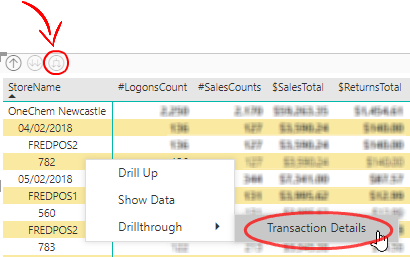
- Drill down to the batch ID level then right-click and select Drillthrough > Transaction Details.
You must clear any filters that already exist in the Transaction Details pane.
The POS Discounts in the Store Sales section is intended to assist you with reporting on discounts consented at the POS, by cashier and by product.
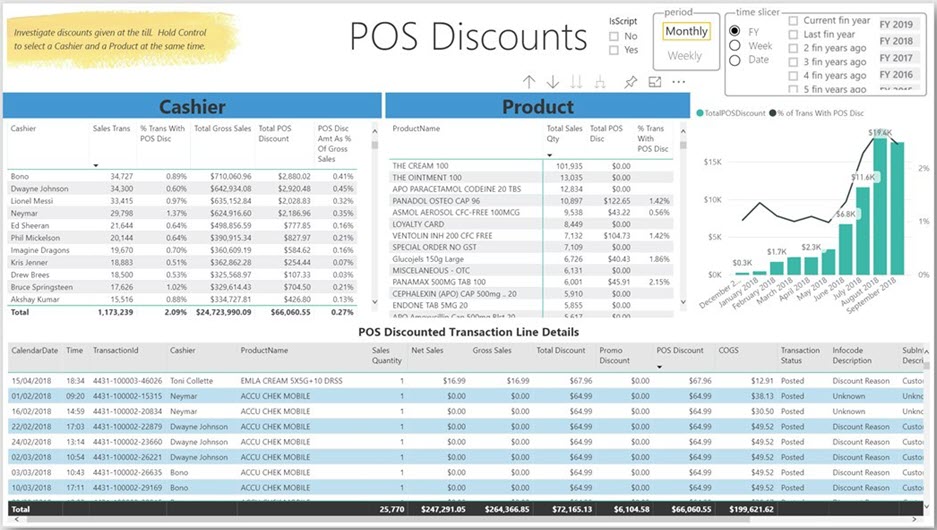
Discount reporting can be split to separate Promotions Discount and POS Discount, using two new measures: TotalPOSDiscount and TotalPromotionsDiscount.
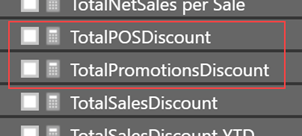
In all reports, TotalSalesDiscount is the sum of (TotalPOSDiscount + TotalPromotionsDiscount).
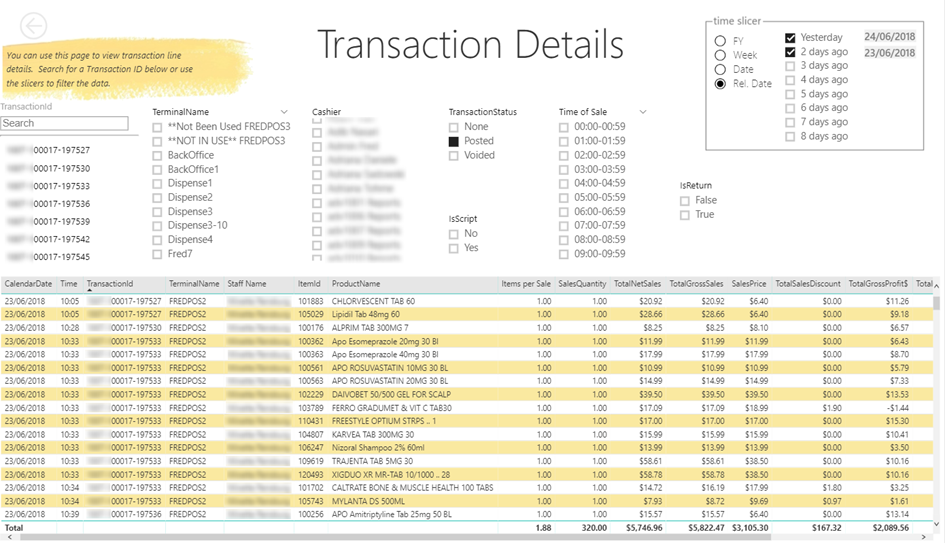
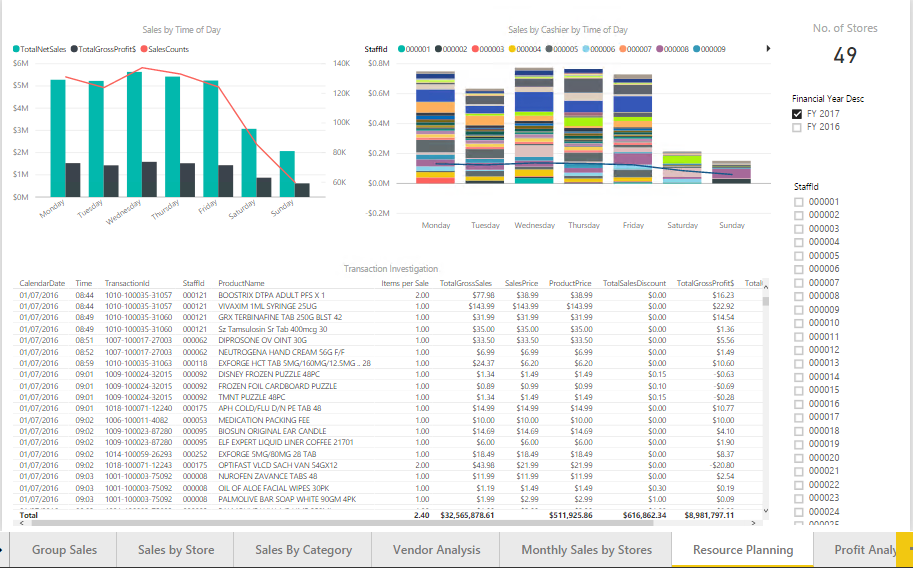
The Transaction Details report displays line level transaction information.
Be aware that this report will run very slowly if a large number of transactions are requested. It is recommended to restrict the transactions shown, either with the slicers above the table or by selecting a narrow date range in the time slicer.
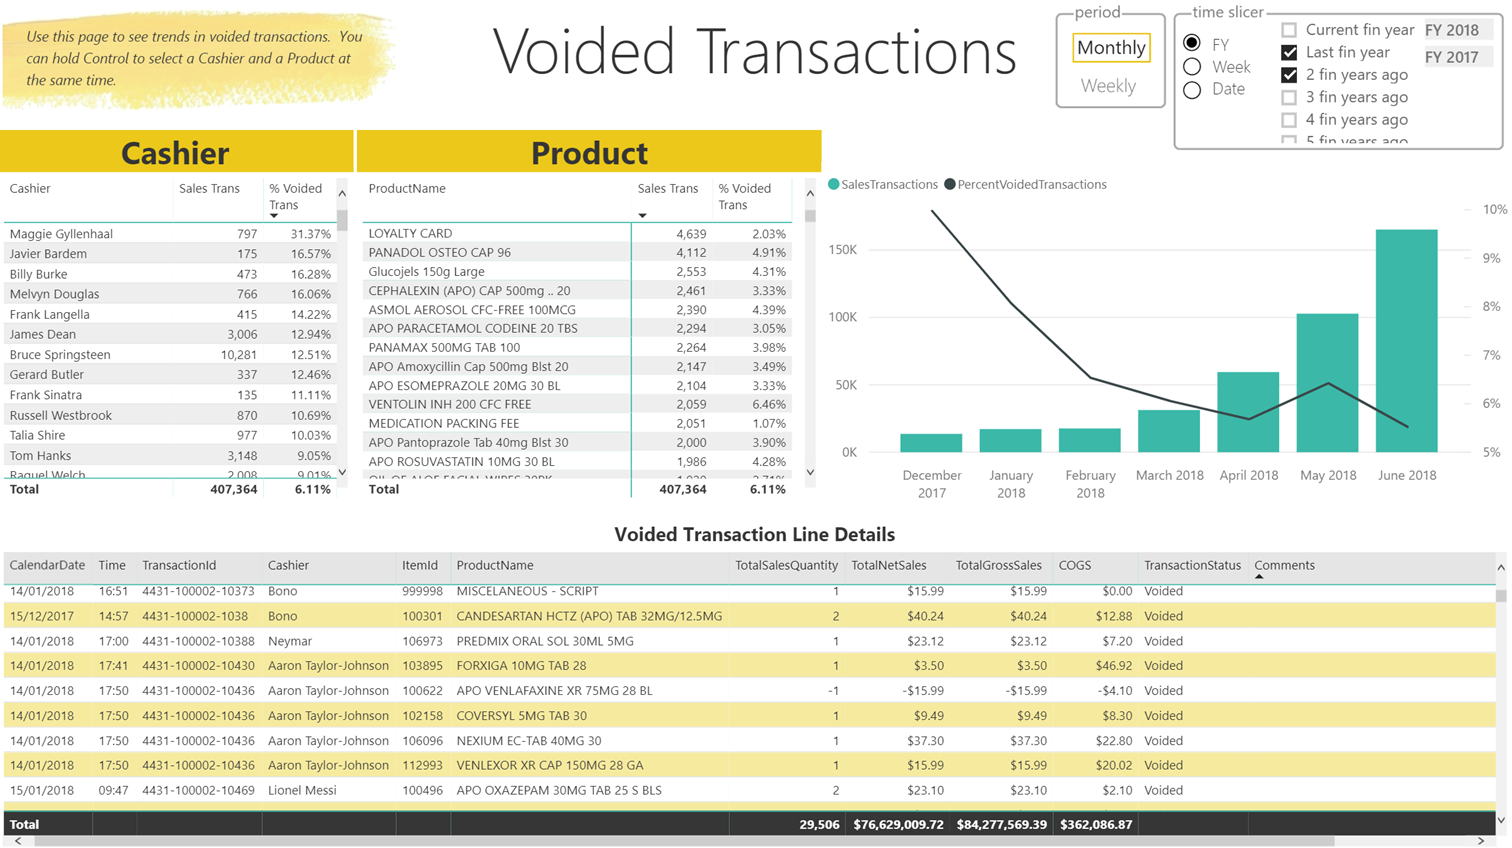
- Click a row in either the cashier or product table to filter the other table.
- Hold the [CTRL] key and click both tables to filter the details table.
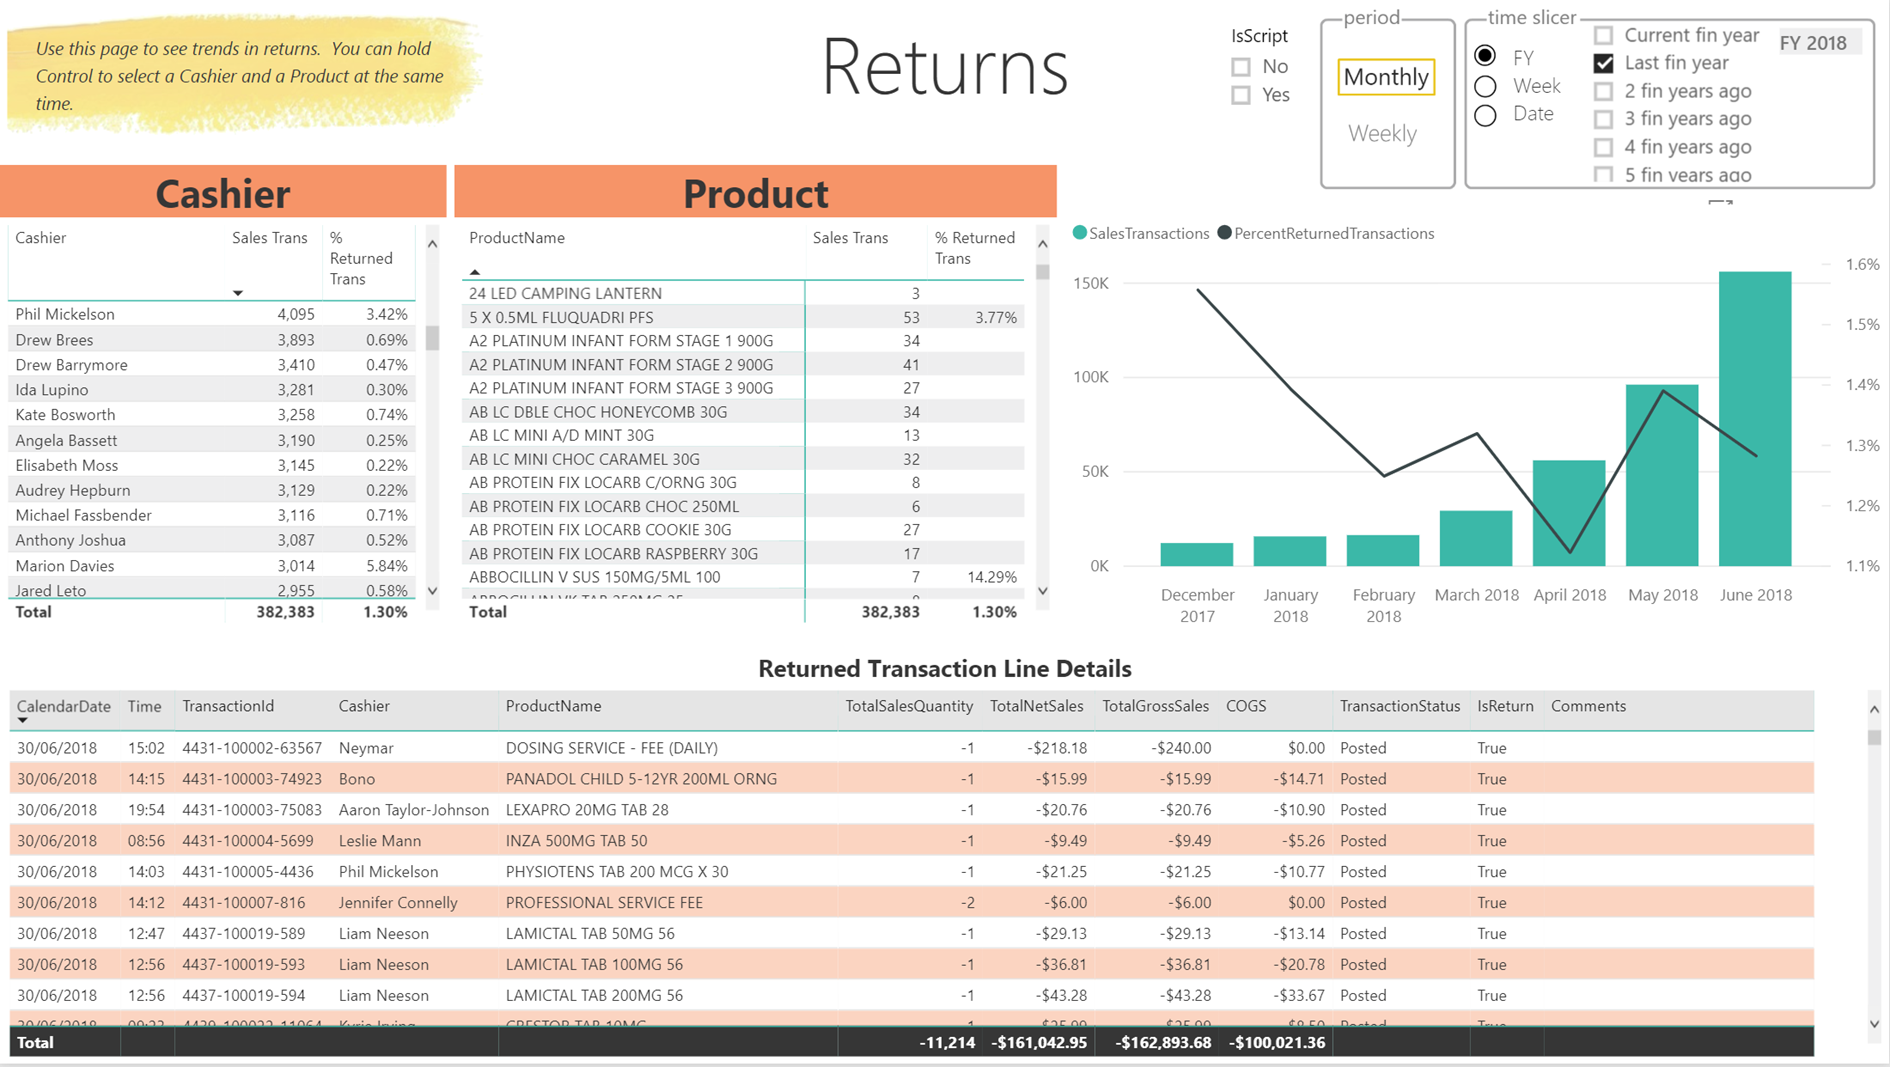
Use this report to see which products are being returned and which staff are processing those returns. The functionality is similar to the Voided Transactions report.
- Click a row in either the cashier or product table to filter the other table.
- Hold the [CTRL] key and click both tables to filter the details table.
To report on Chemotherapy scripts, use the new IsChemo flags located in the Sales table and Script table to create your own chemotherapy reports.

Sales analysis
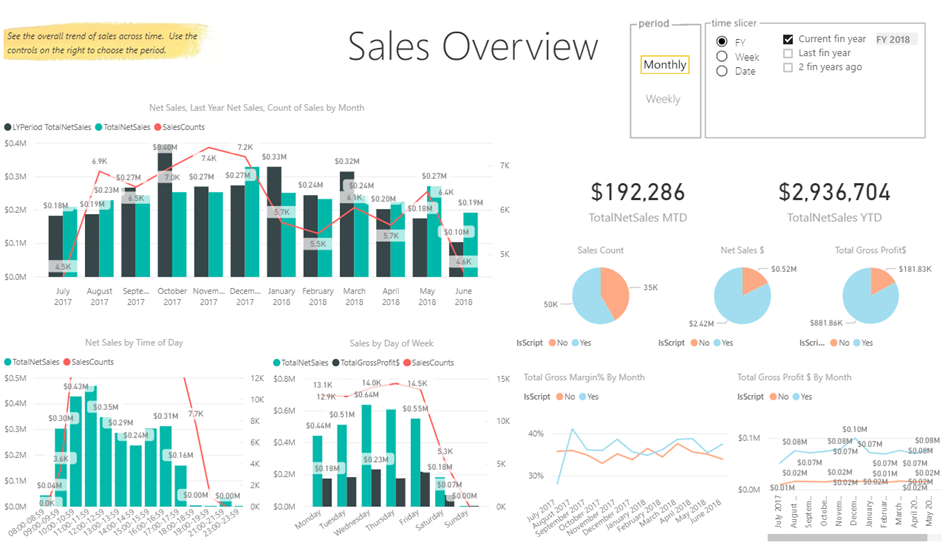
The former Weekly Sales and Sales Efficiency reports have been merged into Sales Overview.
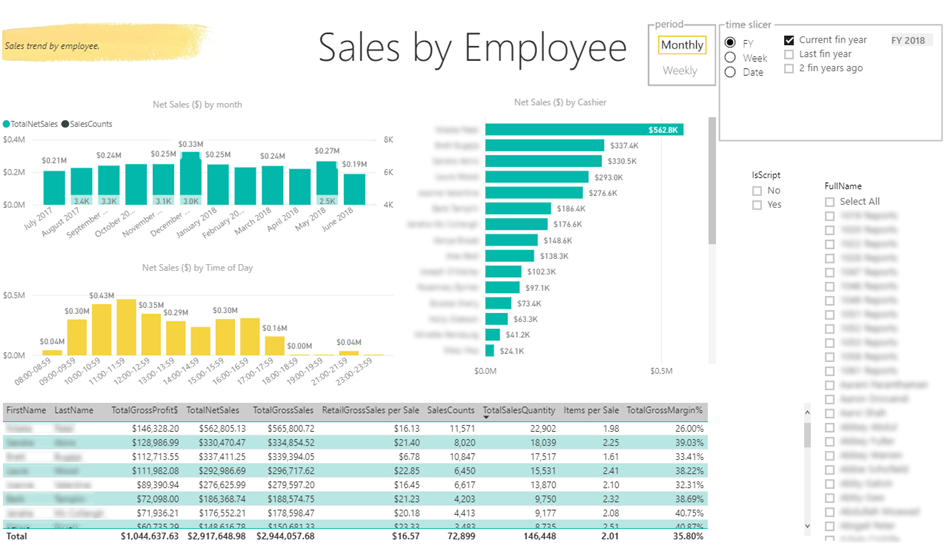
- Use the Period selector and the time slicer to select the relevant time period for your report.
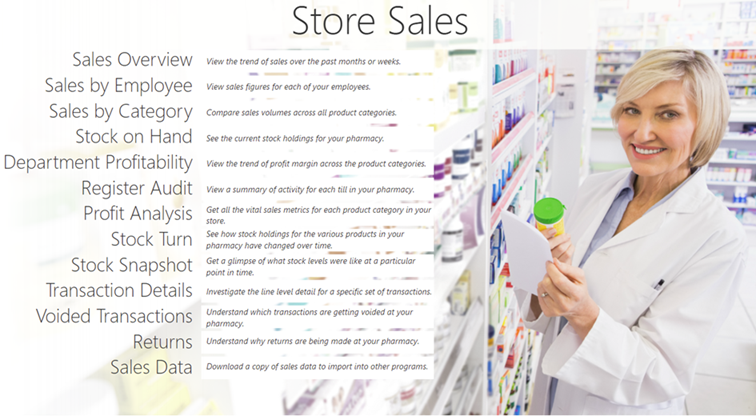
A contents page provides a list of available reports with a short description.
Stock reports
The SOH reports allow you to view their current inventory value and stock holding.
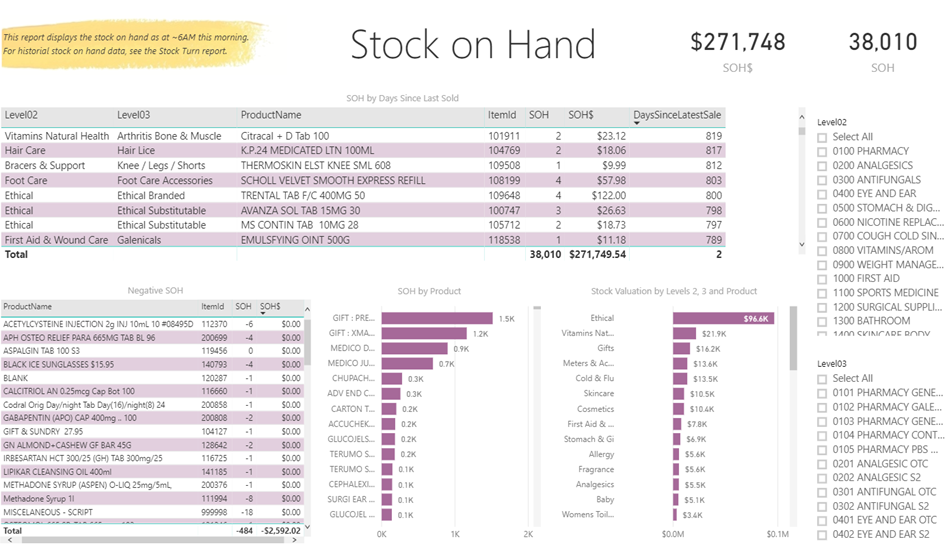
The page also includes a list of committed stock, where the item has been either dispensed, but not collected (uncollected scripts); or has been ordered by a customer, but not yet paid for.
The Negative SOH report allows you to monitor your stock levels and address any issues with your inventory.
You can also filter this report by level 02 and level 03.
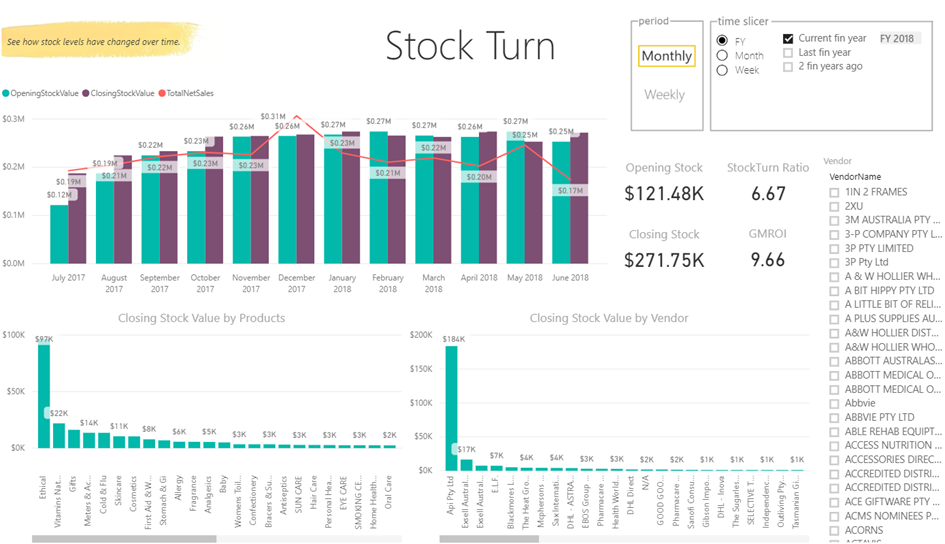
The Stock Turn report displays the change in stock valuation across a set period. Data can be viewed at a weekly or monthly level. It also displays Stock turn ratio and GMROI (Gross Margin Return On Investment).
- Closing Stock – the closing stock value for the last day in the date range shown on the page.
- Opening Stock – the opening stock value for first day in the date range shown on the page.
- Stock turn ratio = the number of times over the selected period that the stock has turned over.
- Calculation = Cost of goods sold / average stock value
- where Average stock value = (opening + closing stock) / 2
- GMROI = Gross Margin Return On Investment
- Calculation = Gross margin / Average stock value
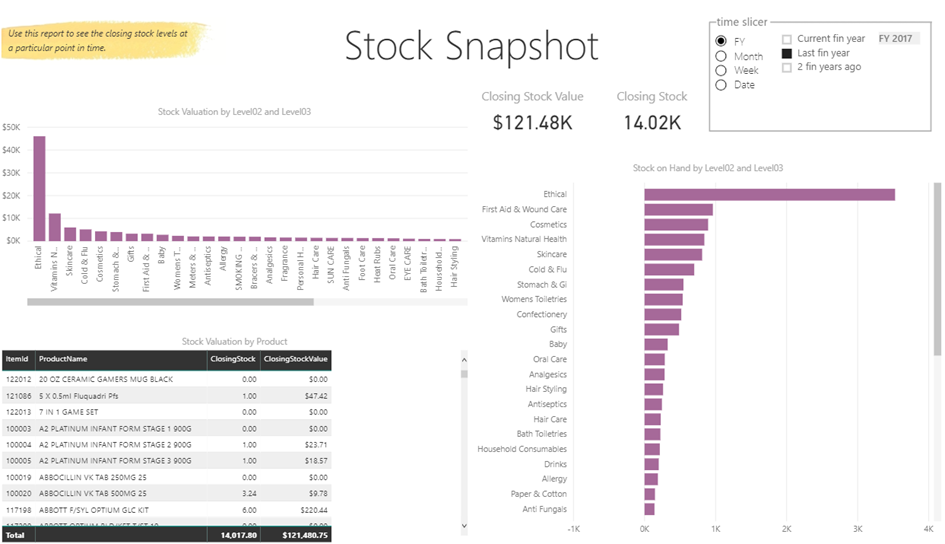
From June 2018, the Stock Snapshot report replaces the EOFY report.
This report provides a snapshot of closing stock values across product categories for any chosen date.
With the time slicer set to Last fin year as shown, the report will default to the last day in the previous financial year.
This report is designed to highlight stock which is not selling well.
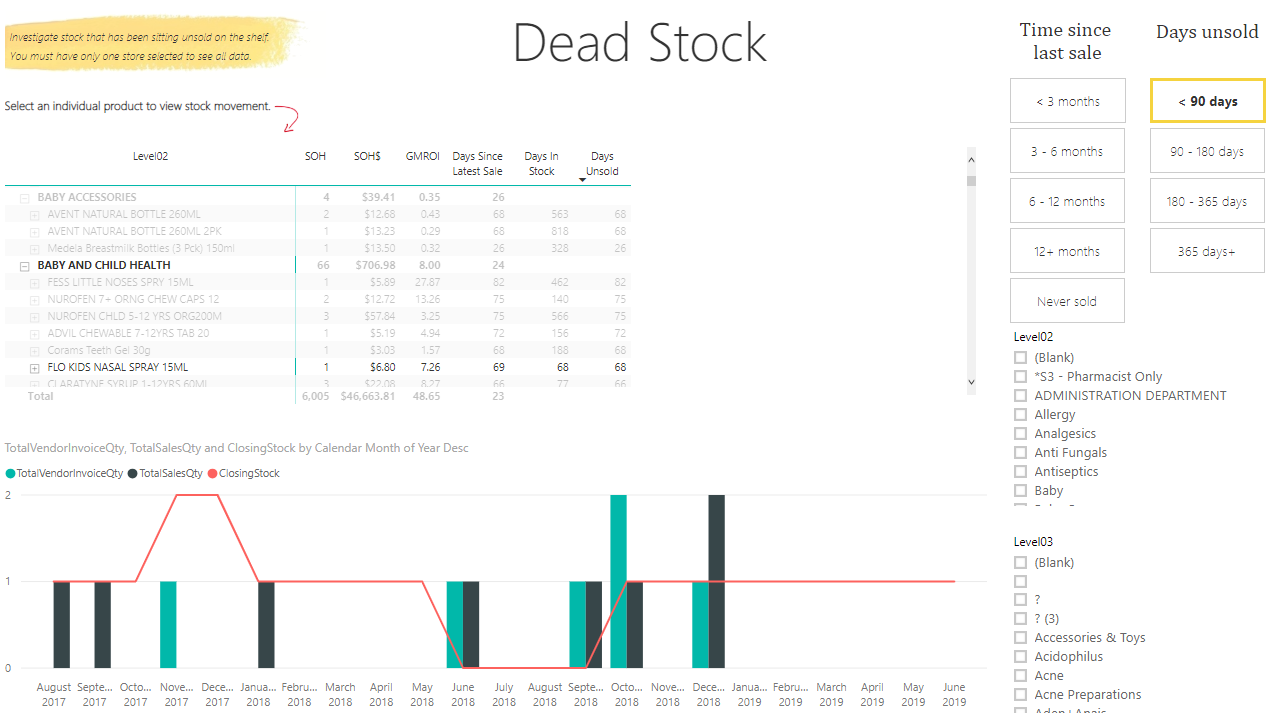
You can only report on dead stock in one store at a time. If multiple stores are selected, the report displays no data.
Products and categories are shown in the table on the top left along with two new measures:
- Days in Stock – The number of continuous days the product has had a positive stock on hand up to today.
- Days Unsold – The minimum of Days in Stock and Days Since Latest Sales.
Use the Filters (on the right) to quickly filter the table based on either the Time since the last sale or Days Unsold.
The chart section displays the stock movement for the highlighted product, as well as the sales and purchases of the product. By default, it shows the data aggregated by month, with the option to display daily figures.
This chart only displays data if a product is selected in the table. If no product is selected, the chart is blank.
 Fred Learning Pathways