Purchase Orders
Reports
Purchase Orders reports - Head Office and Stores
The Purchasing report is presented as a set of six specialised reports.
This report provides a high-level overview of purchasing:
- How much is being spent with each vendor.
- Which products account for the highest volume and dollar value.
The chart in the top left allows easy comparison of the total dollar value spent with each vendor.
- Click one or more vendors from chart (by holding CTRL on the keyboard) to filter the other charts and tables in this report.
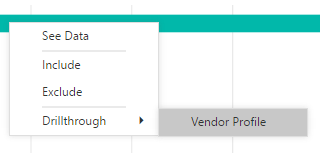
- Right-click a vendor in this chart and select Drillthrough > Vendor Profile to view the Vendor Profile report for that vendor.
The bottom left visual charts the number of purchase orders placed per week.
The Head Office report also contains a visual of purchased quantities by store whereas the store report includes a chart with product level 02.
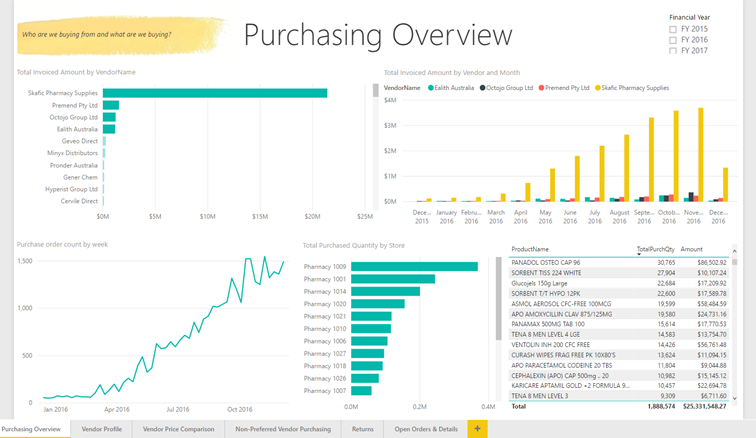
Head Office Purchasing Overview
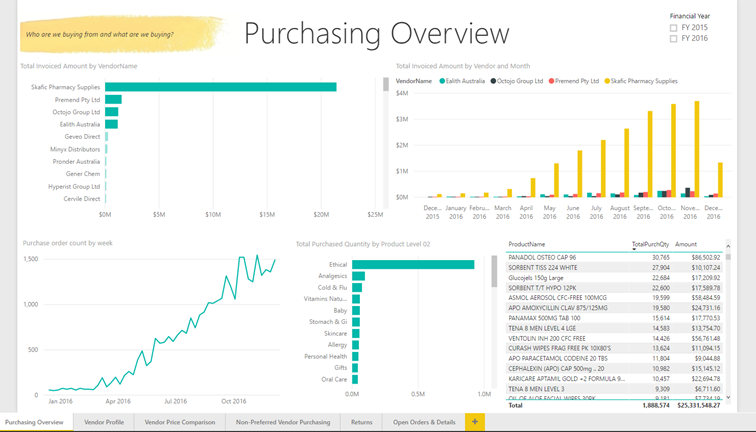
Store Purchasing Overview
This report allows users to focus on one vendor at a time, answering such questions as:
- How much do I spend with this vendor?
- What products do I buy?
- How has the price of those products changed over time?
- How well is the vendor servicing my business?
The cards on the left measure:
- Total Invoiced Amount – the total dollar value spent with that vendor.
- Average Days to First Receipt – the average number of days the vendor takes to fulfil (completely or partially) a line item in an order.
- % of PO Lines Short Supply – the percentage of purchase order lines that are only partially fulfilled in the first delivery, e.g. if the vendor does not have enough stock on hand.
- % of Qty Arrived on First Delivery – the quantity that arrived on the first delivery of an order divided by the total quantity ordered, expressed as a percentage. For example, if 10 items were ordered and only 8 were delivered on the first delivery this metric would report 80%.
The visual on the top right graphs the movement of price of a single product over time. It will only show data if a single product is selected from either the table in the centre or from the filter pane on the right.
The bottom left visual tracks Average Days to First Receipt (discussed earlier) over time.
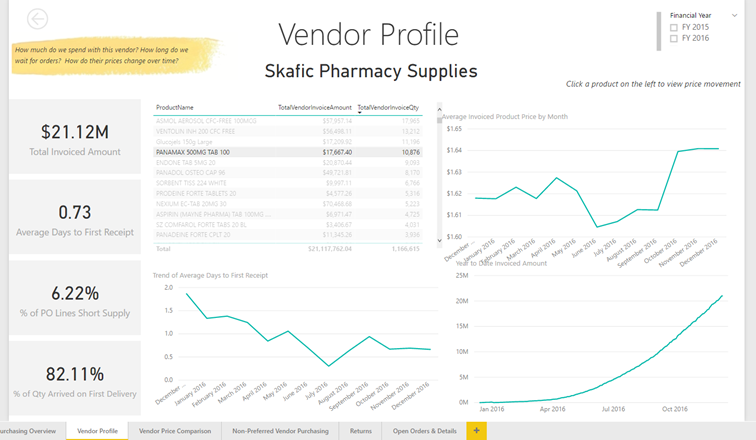
The Head Office and store versions of this report are identical.
Some products can be purchased from more than one vendor. This report allows users to compare the prices charged by those vendors for those products.
The table in the top left shows products that have been purchased by more than vendor. By clicking a product in this table, users can then see:
- A comparison of vendors from whom this product was purchased in the centre table.
- The quantity purchased through each vendor by month in the bottom left chart.
- A comparison of the price charged by each vendor over time in the bottom right chart.
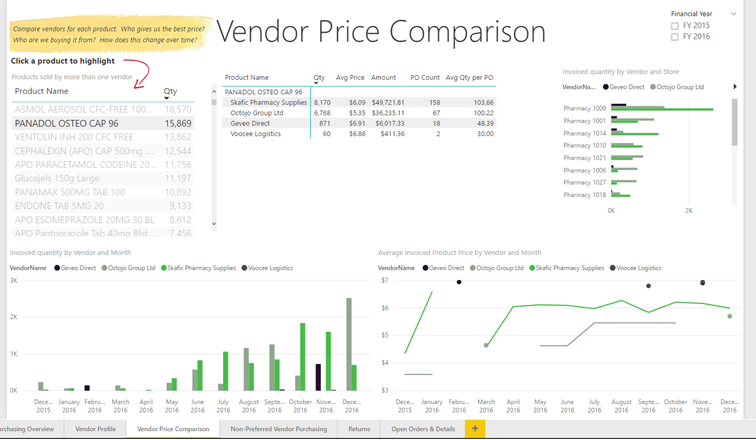
The Head Office version of this report has a breakdown of invoiced quantity by store.
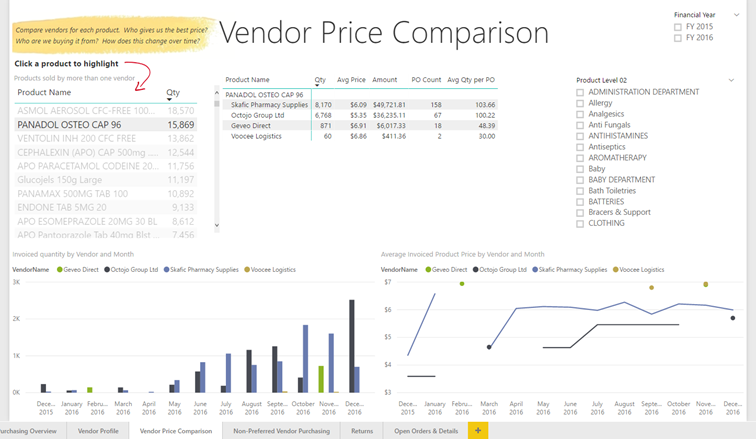
The store version has a slicer for product level 02.
Fred NXT allows users to nominate a preferred vendor for each product and store. The Non-Preferred Vendor Purchasing report highlights purchases that were made from vendors that are not the preferred vendor for that product.
- The table on the left lists the sales gained by vendors that were not the preferred vendor for the product sold.
- The centre table lists the same value, but against the preferred vendor that lost the sale.
Selecting a vendor from one table will filter the other table, allowing users to see which vendors gained sales from which other vendors.
- The top right visual charts the purchased quantities and invoiced amount by product.
Users can filter this chart by selecting a vendor in either of the two tables previously mentioned, or use this chart to filter the two vendor tables.
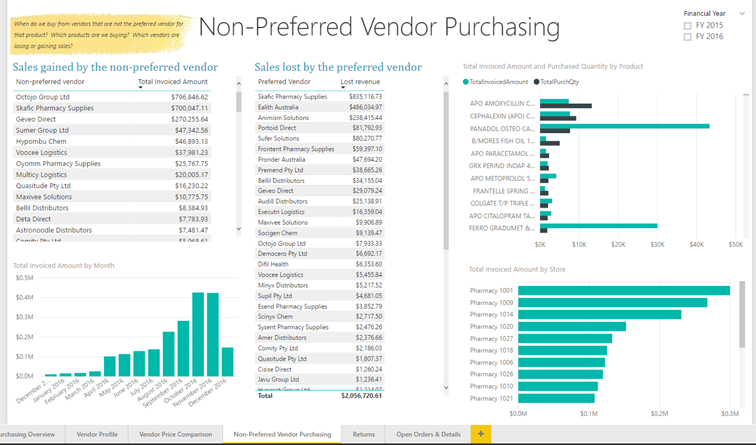
The Head Office version of this report also reports the invoice amount by store.
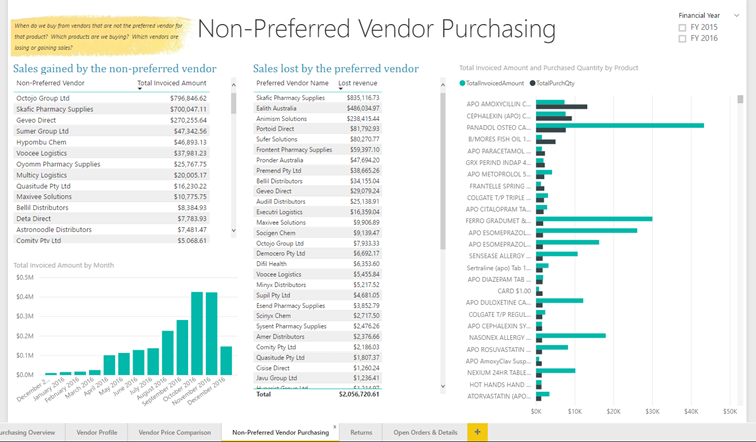
This report allows users to see which products are returned most often and to which vendors are they being returned.
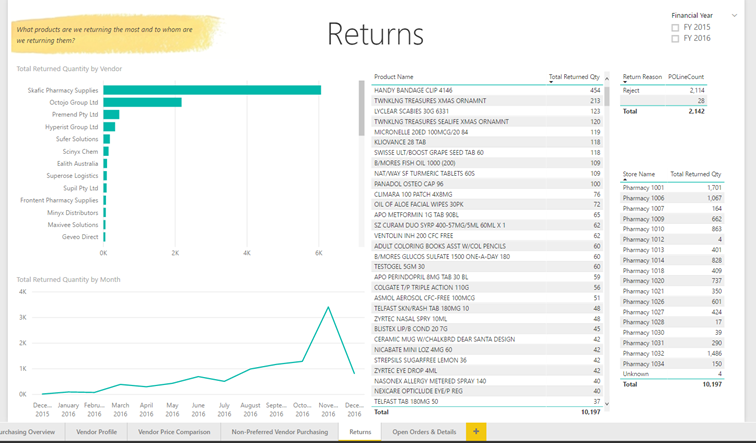
The Head Office version has a breakdown by store.
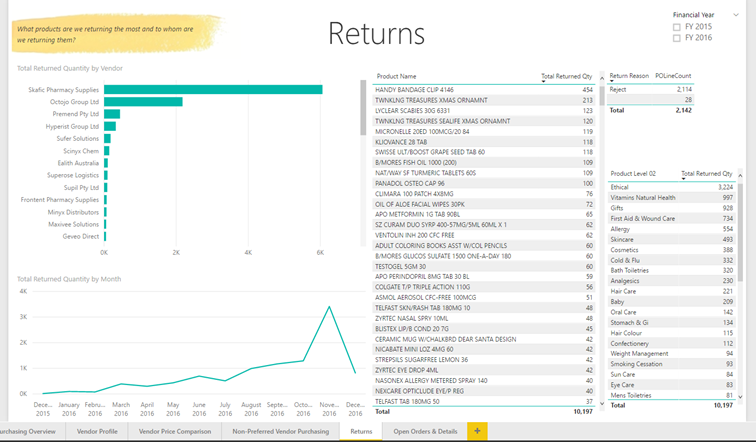
The store version includes a breakdown by product level 02.
This report serves two purposes:
- to visualise the currently open orders.
- to see the line-level details of any purchase order.
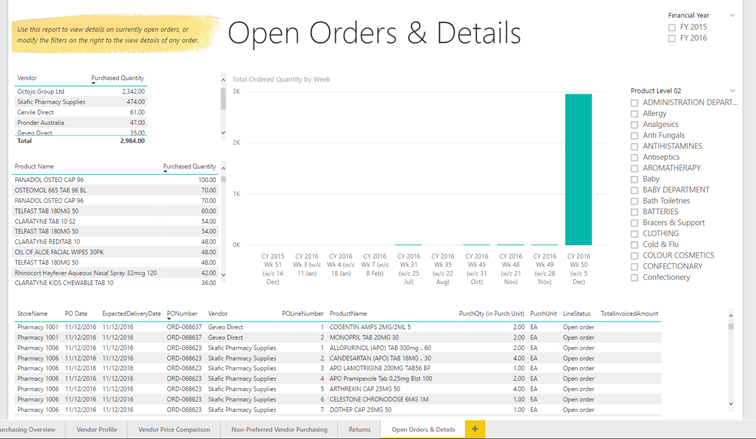
The top four visualisations summarise product quantities from open orders in terms of vendor, product, week and store (Head Office report only).
The bottom table contains line level information for purchase orders. By default, it is filtered to open orders via the page level filter on LineStatus. Remove this filter to show details of all orders, not just open orders.
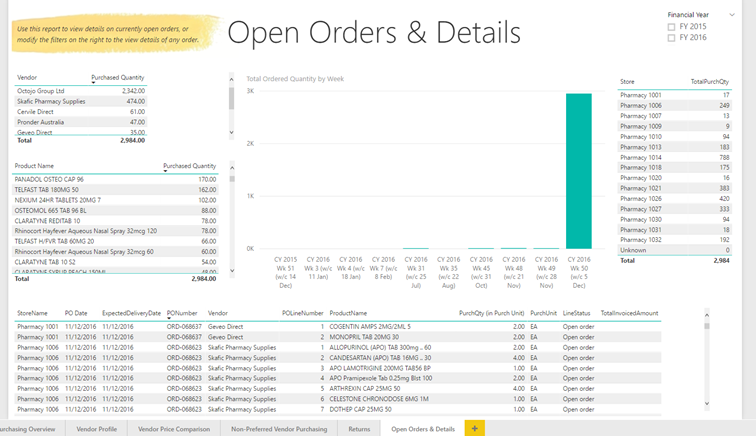
The Head Office version has a breakdown by store which is replaced by a slicer for product level 02 in the store version.
Purchase Orders reports - Store
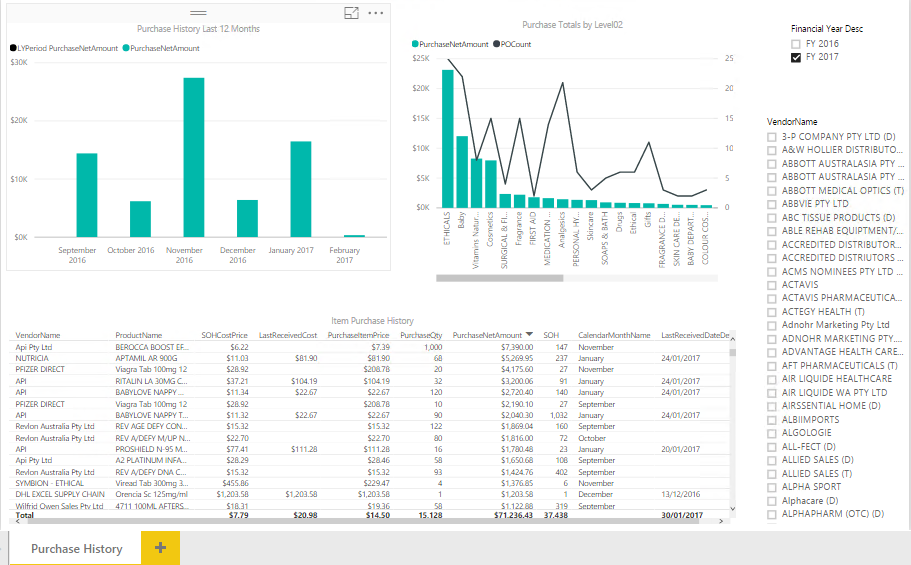
Purchase History Report – Store
View the purchase history for an item
- Item Purchase History table displays monthly purchase history totals for each item that has been purchased in the selected date range (past 12 months by default in report level filters).
- SOHCostPrice is the current calculated Cost price.
- LastReceivedCost is the last invoiced cost.
- PurchaseItemPrice is the Unit price from the PO.
- PurchaseQty is the total quantity purchased for the month.
- PurchaseNetAmount is the Net Amount from the PO ie. Unit price * Qty ordered.
- SOH is the current SOH (we do not currently store historical SOH but this will change in the near future).
- CalendarMonthName – the month in which the item was purchased.
- LastReceivedDateDetails – the date of the last invoice for the item.
View Monthly Purchase totals for the past 12 months and compare to Last Year totals
- Purchase History Last 12 Months report displays the PurchaseNetAmount for each month over the past 12 months and compares this to the LYPeriod PurchaseNetAmount (the same period in the previous year).
View Purchase totals by Level02
- Purchase Totals by Level02 report – columns display the total PurchaseNetAmount for each Level02.
- The line displays a count of Purchase Orders for each Level02 over the selected date range (past 12 months by default).
Slice by Vendor
- User can select a Vendor(s) from the slicer to view PO history details for the vendor(s).
Filters
The following filters are available in both Head Office and Store versions of the Purchase History report:
- Calendar Date
- Financial Year Description
- Level02
- Level03
- Order status
- PO number
- Product Name
- State
- Store name
- Vendor name
 Fred Learning Pathways