Access and configure Power BI™ reports
Reports
Power BI™ reports are interactive and highly customisable. They allow you to display and analyse your data in a collection of information pages containing various visual displays of the available historical data at your store. Store users can only see the data relevant to their store. Head Office users have access to additional reporting features to facilitate comparative analysis between stores of the same group. All reports can be copied and customised, then saved for on-going use.
- Go to https://app.powerbi.com/ and sign in.
- Store users have a single sign-on for the store. These credentials are supplied by Fred.
- Head Office users can log in with their Super User credentials.
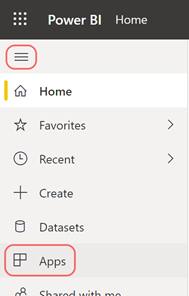
- Expand the navigation menu, then select Apps.
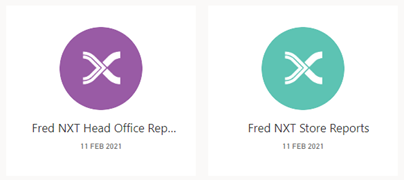
The Fred NXT report apps are displayed.
If you cannot see the Fred NXT report apps:
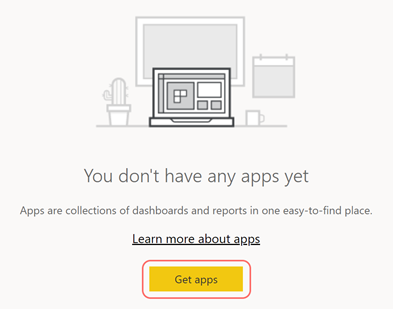
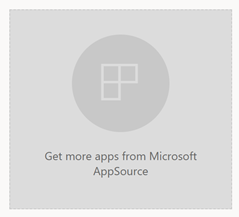
Select Get apps (or Get more apps from Microsoft AppSource).
This will depend on whether you have other apps installed.
- or -
-
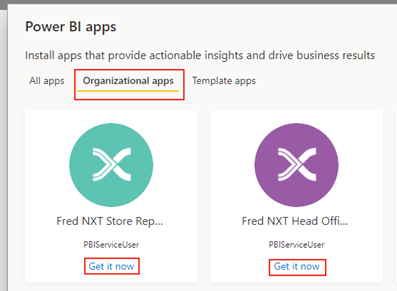
Select Organizational apps, then Get in now to add the available apps to you apps list.
Two apps are available: Fred NXT Store Reports and Fred NXT Head Office Reports. The app will now appear in your apps list.
-
Select one app to open it.
For example, Fred NXT Store Reports
The app contents are listed on the left: the dahsboard is at the top, followed by four reports.
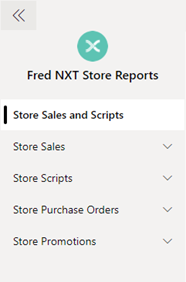
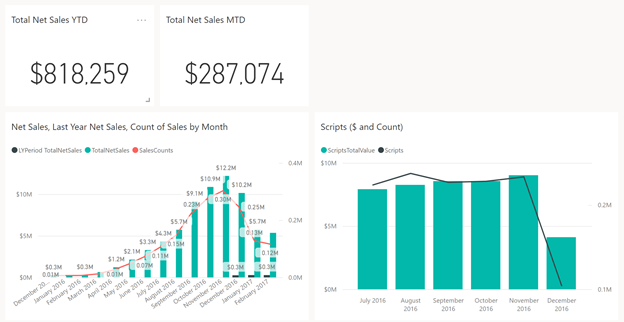
The Dashboard is a high-level overview of your data. You can select a tile to navigate to the report associated with this tile, or you can select the report directly from he navigation menu.
-
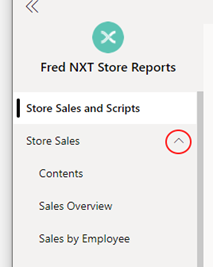
From he navigation menu, select a report section to expand it, then select a report to open it.
-
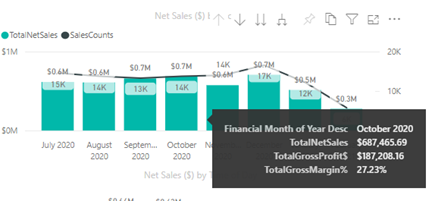
Hover over the report elements to provide additional information.
-
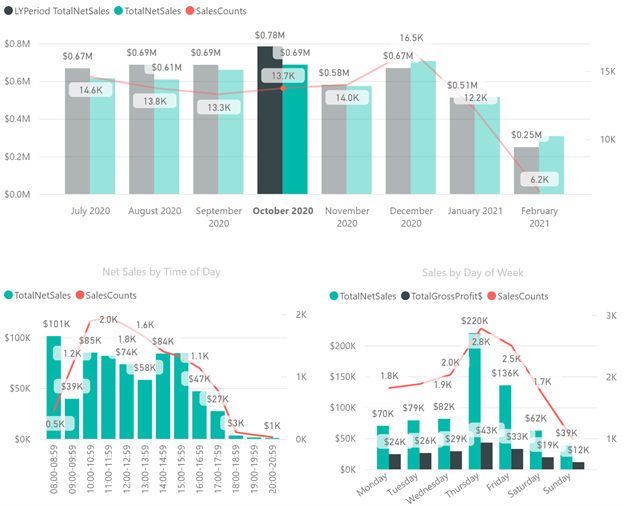
Select an element (for example, a bar from a bar chart) to focus on the data in this element.
Press <CTRL> key to select multiple elements.
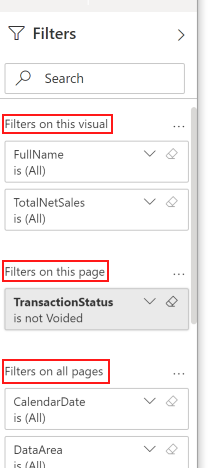
The Filters pane (on the right) displays the filters available to the selected report.
There are three types of filters:
-
visual filters - Visual filters are only available when an element on a report page has been selected.
-
page filters
-
all-page filters
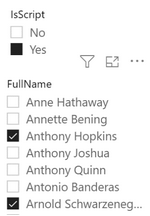
Slicers can be used to quickly filter data on that page.
Press <CTRL> key to select multiple items.
Period toggle
Toggle certain report elements between monthly and weekly views.

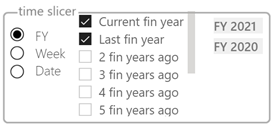
Time slicer
This slicer allows you to filter the data either by financial year, week or date.
Drill down
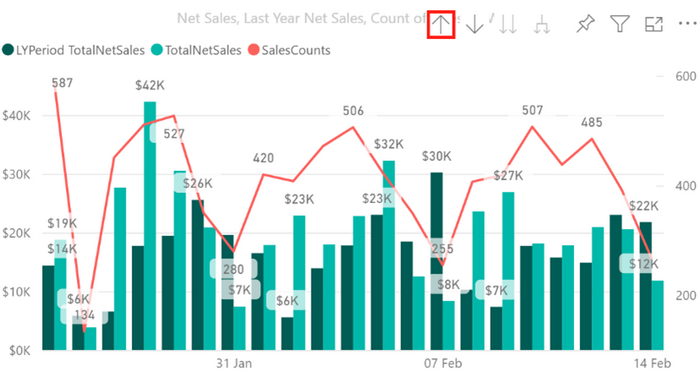
Some charts contain multiple layers of information.
-
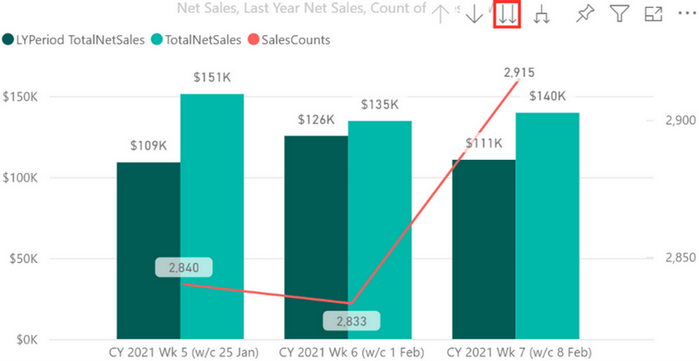
Select either
 to “drill down” to the next level of data, and go directly to the next level of data.
- or -
Select
 to include the current level in the chart.
- or -
Select
 to return to the upper level of the data.
For example, if you select  on the weekly sales chart, you drill down to the daily level data.
-
Select a report in one of the apps, then select File and Save a Copy.
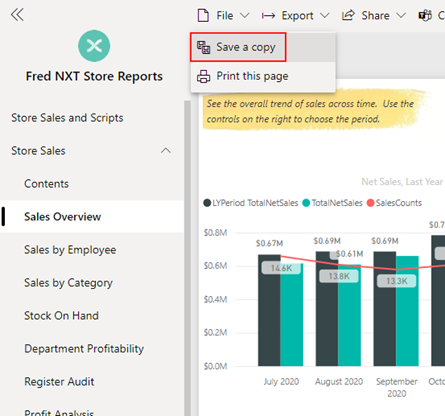
A copy of the report is saved in your personal workspace.
-
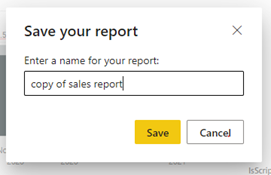
At the prompt, provide a name for the copy.
-
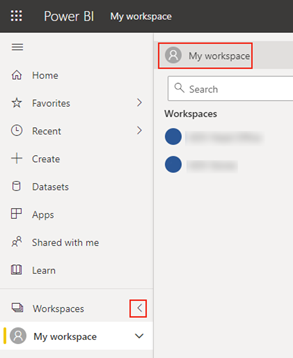
To open the copied report, select Go back (bottom of the navigation menu) to return to personal workspace.
-
Refresh your browser window to display your copied report under Content.
-
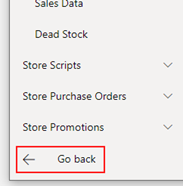
Select Go back (bottom of the screen).
 Fred Learning Pathways