Reports Toolbar
The Reports Toolbar in Fred Office Plus provides quick access to tools that help you run, customise, and share reports. From here, you can apply filters, choose which data to display, adjust the layout, and export or email results.
The Reports Toolbar also lets you interact directly with report data. You can update items, edit pricing, or switch to chart views to better understand the results.
The toolbar is designed to support faster reporting and make it easier to tailor reports to your needs.
The action buttons on the toolbar are described below.
 Save the current report with your selected filters, columns, and layout for future use.
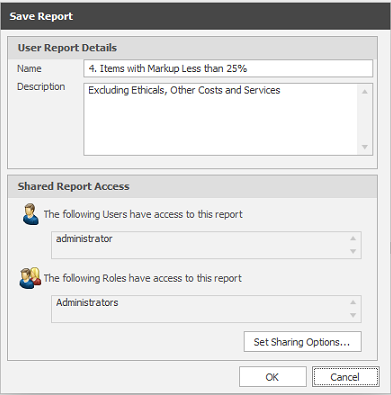
 Save a new copy of the report with a different name.
Use this when you want to keep multiple variations of the same report.
 Run or refresh the report using the current filters and settings.
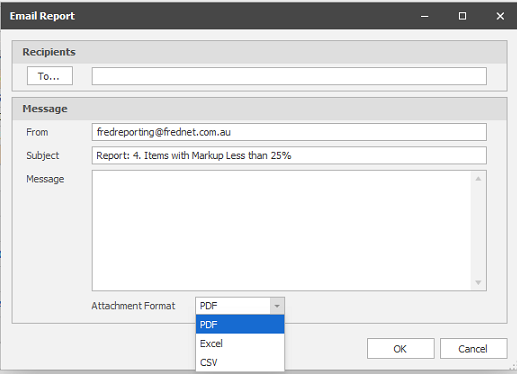
 Send the report via email to selected recipients.
The report is sent using your current filters, columns, and format.
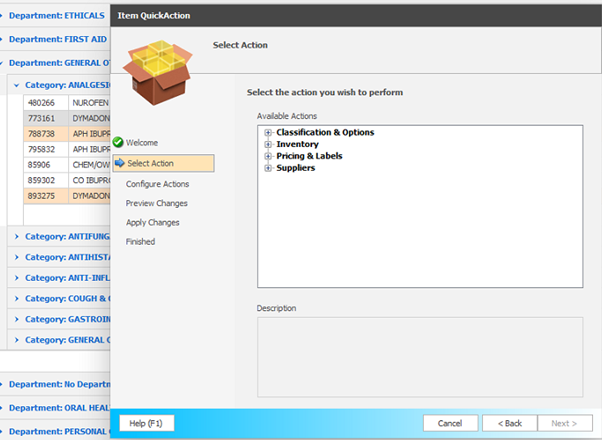
 Perform quick actions on selected items directly from the report.
For example, update item details or move items between categories.
 View how the report will appear when printed before sending it to the printer.
-
Print: select the printer to be used.
-
Quick Print: default printer of the local computer.
-
Page Setup: adjust paper size and orientation, as well as margins.
-
Export Document: additional export options are available from the File menu in the print preview, including RTF, DOCX, and TEXT.
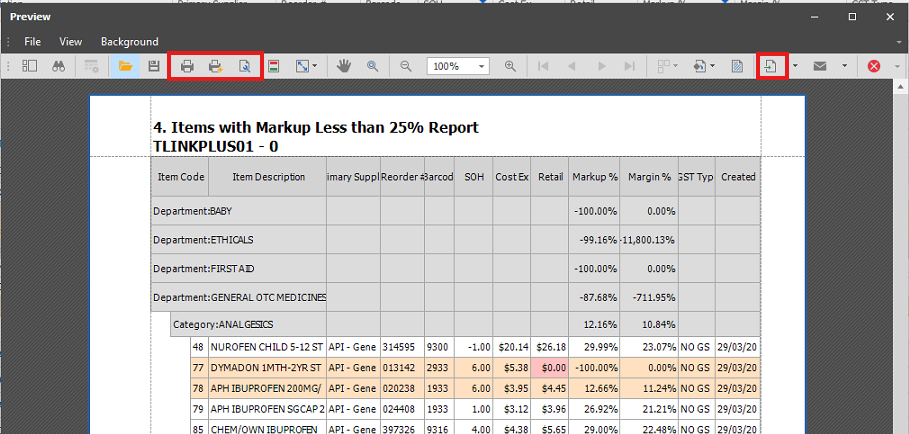
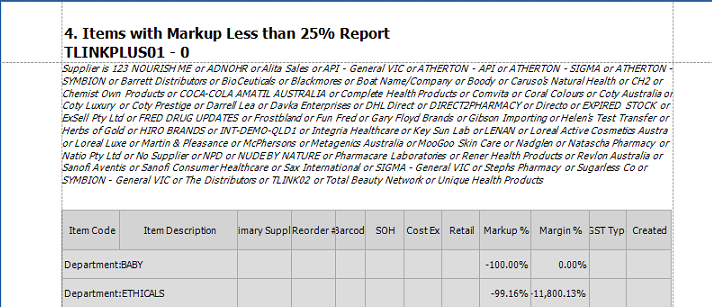
 Export the report to a file format such as Excel, CSV, or PDF for further analysis or sharing.
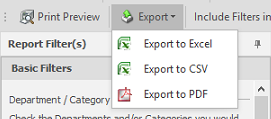
 Include the selected filters in the report output (e.g. when printing or exporting), so it is clear how the data was filtered.
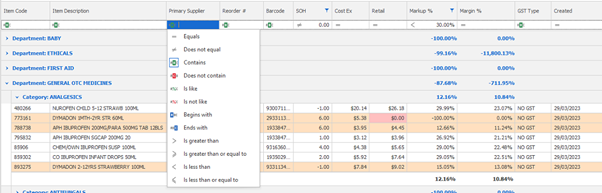
 Show or hide the filter row at the top of the report.
The filter row allows you to quickly narrow down results by entering values directly into each column.

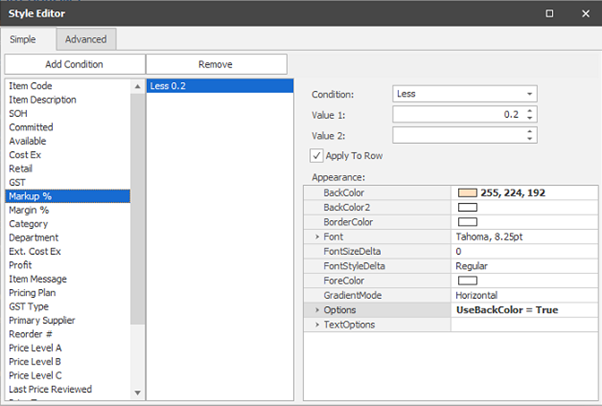
 Select which columns are displayed in the report.
This helps you customise the report layout to show only the information you need.
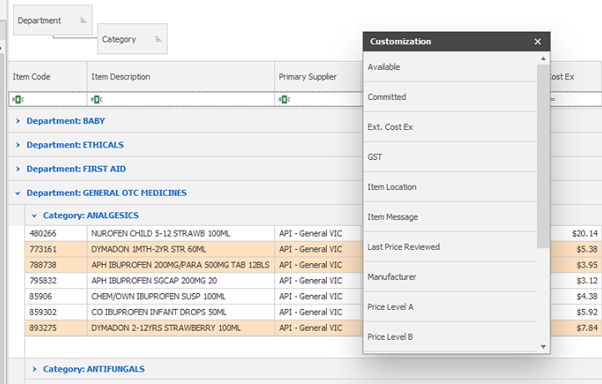
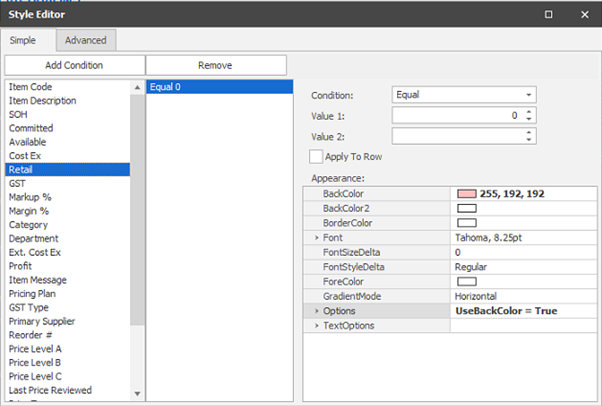
 Adjust the visual appearance of the report, such as fonts, colours, and formatting.
Conditional formatting can be created to update the look and feel of reports within Fred Office Plus, creating dynamic visual cues.
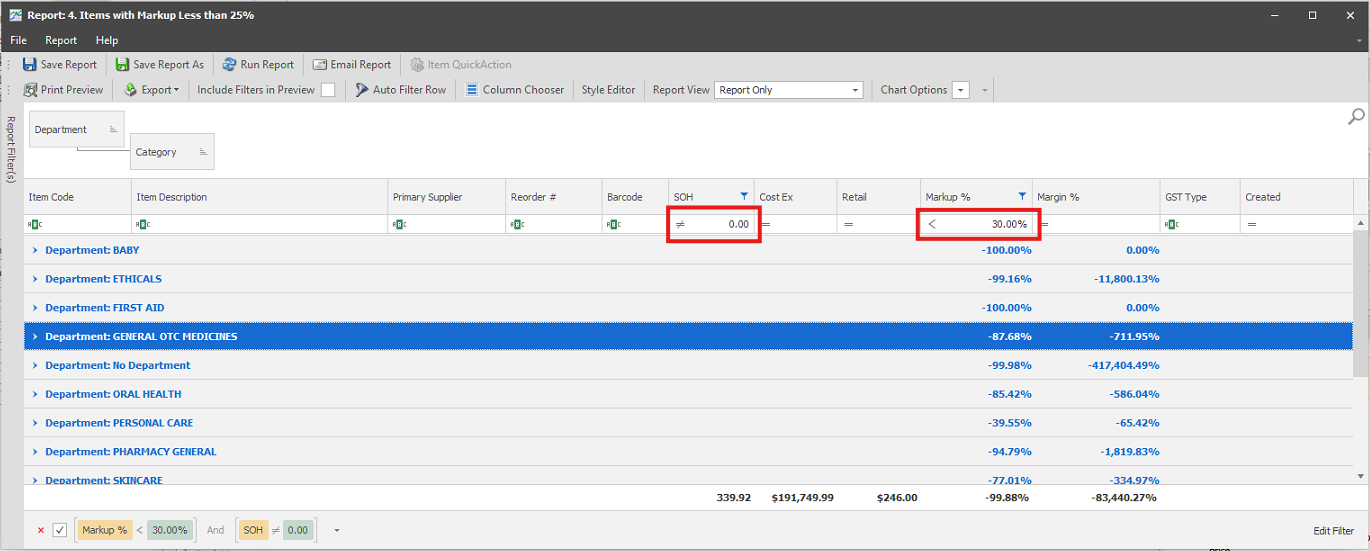
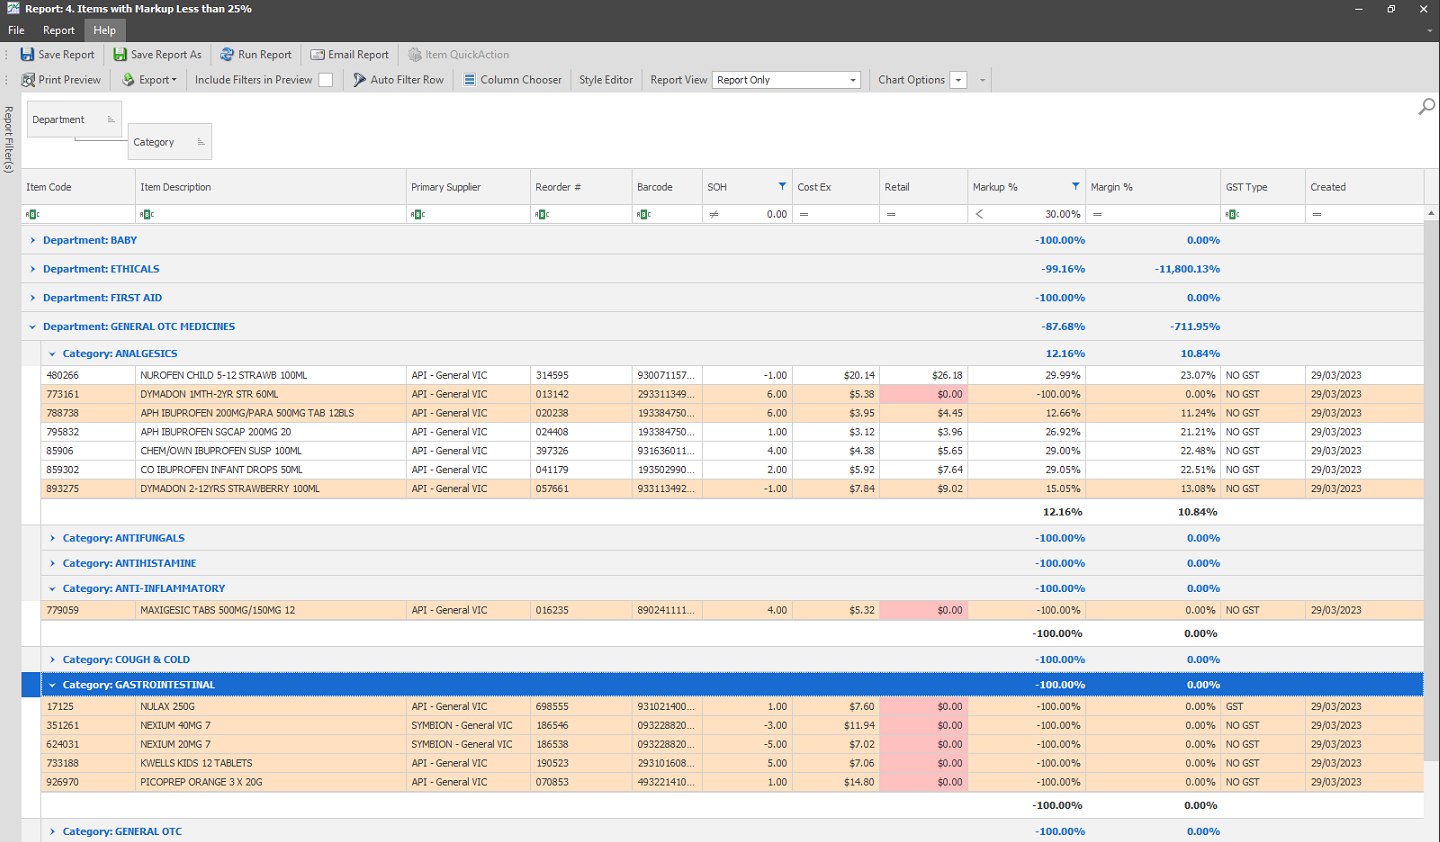
Item Pricing Detailed report, filtered to show all items with Stock on Hand and a Markup of less than 30%.
 The Style Editor can change the appearance of rows and cells for additional filters.
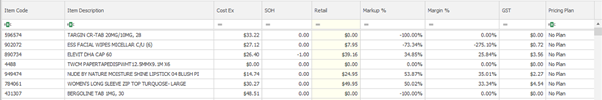
Highlight the row of any item where markup is less than 20%:
Highlight the retail cell red where the retail price is $0.00:
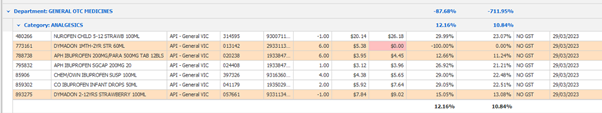
Results of the above additional visual filters:
 Edit pricing-related information directly from the report (where applicable).
This is typically used when reviewing or updating item pricing.

-
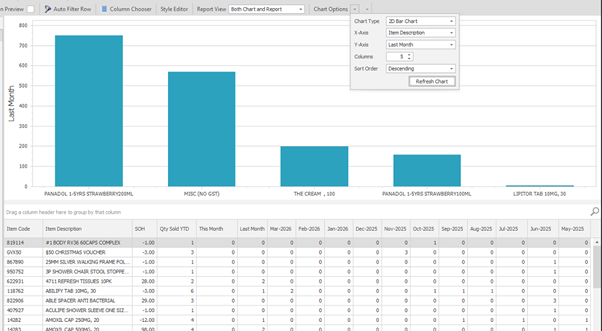
Switch the report view to a chart format.
-
Use this to visualise data trends (e.g. sales performance) instead of viewing in a table format. Select the relevant Chart Type, X-Axis, Y-Axis, Columns, and Sort Order.