Script Reports
In this topic
Script Analysis Report
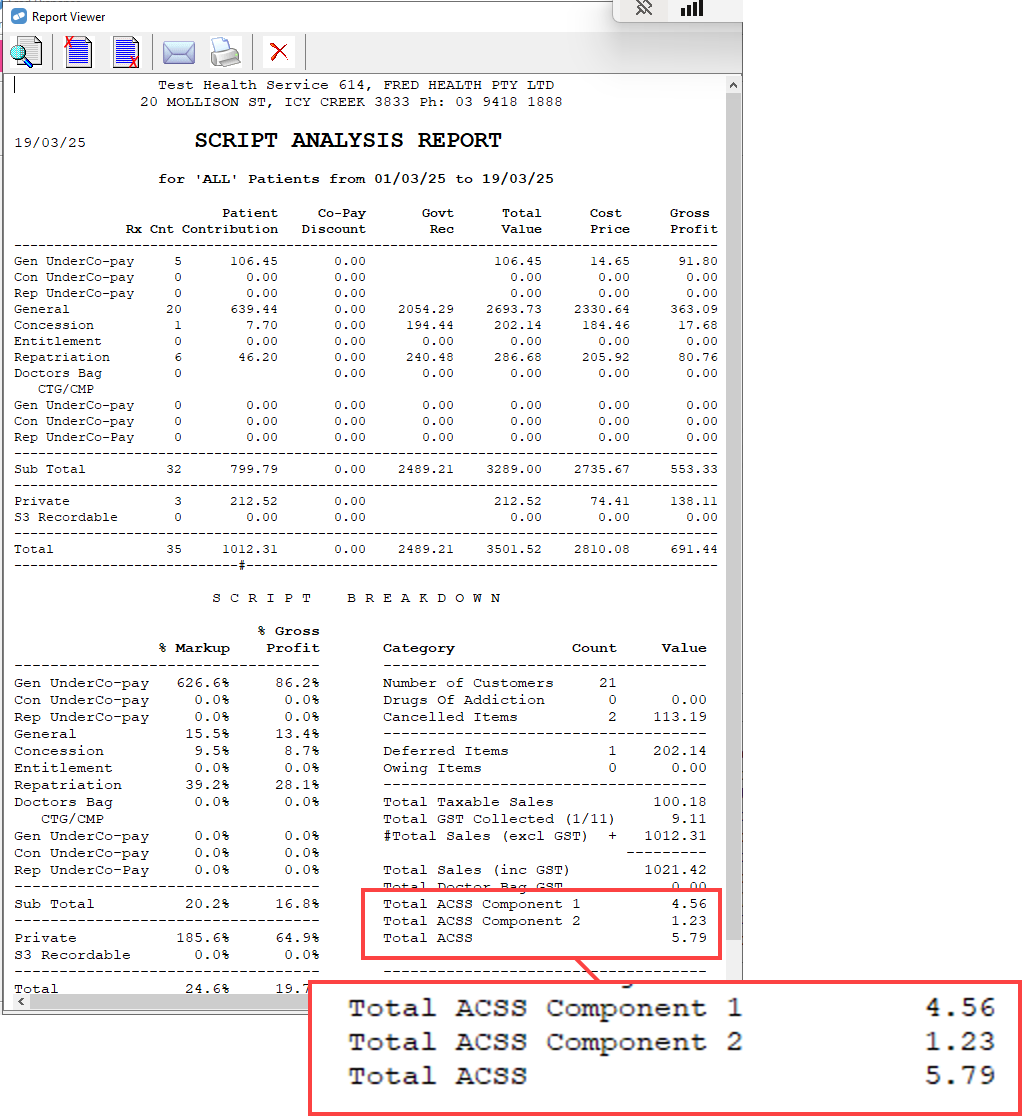
The Script Analysis Report provides summarised information on scripts that have been dispensed. The report can be configured using additional parameters—for example, scripts dispensed in a particular date range or scripts dispensed for patients in a selected nursing home.
-
From the Reports menu [Alt+R], select Script [S], then select Script Analysis [A]. The Script Analysis Report dialog displays.

- Select the type of patients to be displayed:
- A for All.
- H for Nursing Home Patients. Enter a Fast Code or select from the list [CTRL+L]. Leave blank to report on all nursing homes.
- O for Non-Nursing Home Patients.
- Select the date range.
- Type Y in the following fields if you want to include them:
- Include Owing Scripts?
- Include ACSS payments?
- If you want to include '60 Day' Dispensing Only, type Y, otherwise leave as N.
-
In the Drug Cost field, select <= or >= and enter an amount.
The Drug Cost field is particularly useful in filtering out high cost drugs.
-
To run the report, select Generate, or press [Enter] twice.
Click the thumbnail below to see a larger image.
Analyse the report
The Script Analysis Report is divided in two sections:
 Section 1 – Cost of Scripts by Script Type
This section displays the breakdown of dispensed scripts arranged by Script Type.
- Gen/Con/Rep UnderCo-pay details those items for scripts which did not exceed the patient co-payment.
- General includes scripts with a claimed amount.
- Concession, Entitlement, Repat and Doctors Bag
- CTG Gen, Con and Rep UnderCo-pay includes scripts that do NOT have a
- claimed amount (no Govt Rec).
- Private Scripts and S3 Recordable
Section 2 – Script Breakdown
The Script Breakdown section shows the same script types as Section 1, where:
- %Mark-ups is the difference between the total value and the cost price.
- %Gross Profit is the profit relative to the total value.
This section details the Number of Customers, Drugs of Addiction dispensed, Cancelled Items, Deferred Items, Owing Items and a GST summary.
Daily Totals Breakdown Report
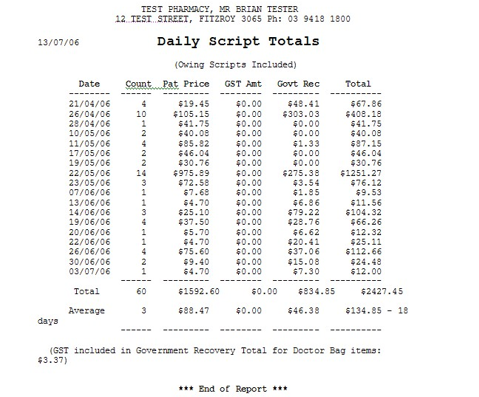
The Daily Totals Breakdown Report is a summary of scripts dispensed each day and their values for a chosen period. The values are broken down into Patient Contribution, GST Amount and Government Recovery.
-
From the Reports menu [Alt+R], select Script [S], then select Daily Totals Breakdown [D].
The Daily Script Totals Breakdown Report popup displays.

- Select the type of patients to be reported on:
- A All Patients
- H Nursing Home Patients
- O Non Nursing Home Patients
- If Nursing Home Patients are selected, press CRTL+L to select one from a list, enter a fast code, or leave blank if you want to display all nursing home patients.
- Select the date range.
- For Include Owing Scripts, enter Y to include or N to exclude.
-
To run the report, select Generate, or press [Enter].
Click the thumbnail below to see a larger image.
Log of Scripts Report
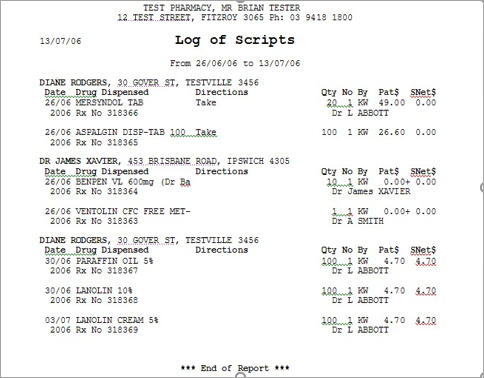
The log of scripts report details Patient Details, Drug Dispensed, Script Number, Directions, Quantity Supplied, Dispensing Pharmacist’s Initials, Doctor’s Details Patient Price and Safety Net Value for a chosen period.
-
From the Reports menu [Alt+R], select Script [S], then select Log of Scripts [L].
The Log of Scripts Report popup displays.

- Select the date range.
- To report on Only Private Items Dispensed, enter Y.
- To report on Only Scripts with GST Added, enter Y.
- To Display Scripts in Number Order, enter Y. Otherwise scripts are displayed in date order.
-
To run the report, select Generate, or press [Enter].
Click the thumbnail below to see a larger image.
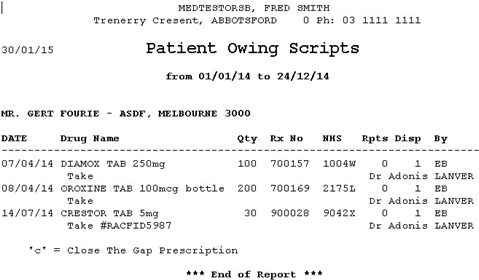
Owing Scripts Report
Report on all owing scripts
- From the Reports menu, select Script, then Owing Scripts. The Owing Scripts Report popup displays.
- Select the Order of Report from the following options to define the sorting order of the report data:Option A: Sort by Dispense Date
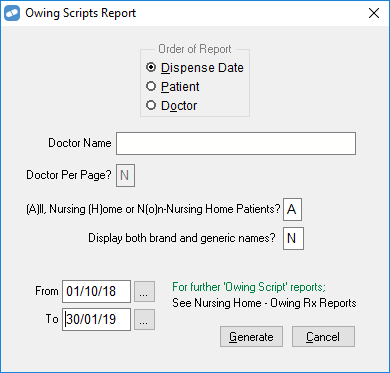
- Select the type of patients to be reported:
- A for All
- H for Nursing Home
- O for Non- Nursing Home Patients
- Enter Y or N depending on whether you want to Display both brand and generic names.
- Select the date range.
To run the report , select Generate or press [Enter].
Click the thumbnail below to see a larger image.

Option B: Sort by Patient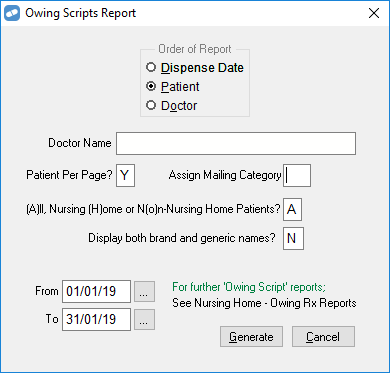
For Patient per Page?, enter Y to start a new page for each patient.
If you select Y, the Assign Mailing Category is displayed. A mail category code allows address labels to be produced easily from the Mailing Labels functionality.
- Select the type of patients to be reported:
- A for All
- H for Nursing Home Patients
- O for Non-Nursing Home Patients
Enter Y or N depending on whether you want to Display both brand and generic names.
- Select the date range.
To run the report , select Generate or press [Enter].
Option C: Sort by Doctor
- For Doctor Name, enter the name of a particular doctor or leave this field blank to report on all doctors.
- For Doctor per Page?, enter Y to start a new page for each Doctor.
- For Doctor owing Costs?, enter Y to report on the costs incurred if an owing script is not recovered. For example, the total of the PBS Govt recovery amount.
- Select the type of patients to be reported:
- A for All
- H for Nursing Home Patients
- O for Non-Nursing Home Patients
Enter Y or N depending on whether you want to Display both brand and generic names.
- Select the date range.
- To run the report , select Generate or press [Enter].
- Select the type of patients to be reported:
Report on owing scripts for a single patient
- In Fred Dispense, select the patient you want to generate a report for.
-
From the Reports menu, select Patient, then Patient History.
The Patient History Report popup displays.
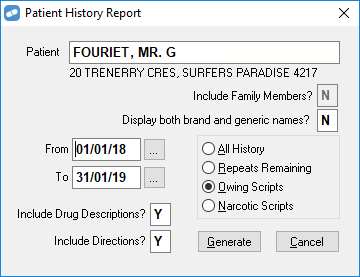
- Select Owing Scripts.
- Select the date range and the other options as required.
-
To run the report, select Generate or press [Enter].
Click the thumbnail below to see a larger image.
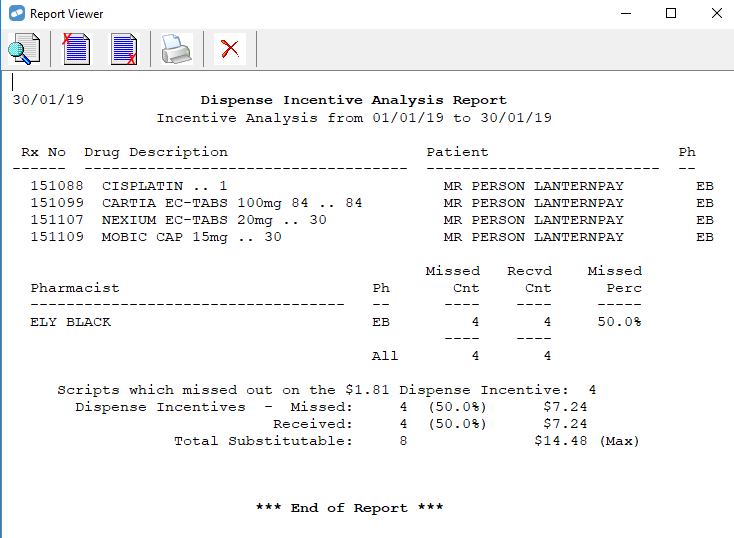
Dispense Incentive Analysis Report
The Dispensing Incentive Analysis report is available to analyse dispensing patterns of drugs where the dispensing incentive could apply.
-
From the Reports menu [Alt+R], select Script [S], then select Dispense Incentive Analysis [I].
The Dispense Incentive Analysis popup displays.
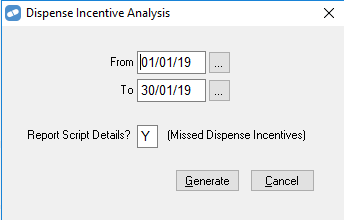
- Select the date range.
- Enter Y if you want to Report Script Details.
-
To run the report, select Generate, or press [Enter].
Click the thumbnail below to see a larger image.
S3 Recordables Report
-
From the Reports menu, select Script, then S3 Recordables.
The Owing Scripts Report popup displays.

- Select the date range.
- For Order Report by Drug Description, enter:
- Y to order the report by drug descripton.
- N to order the report by patient.
-
To run the report, select Generate or press [Enter].
Click the thumbnail below to see a larger image.

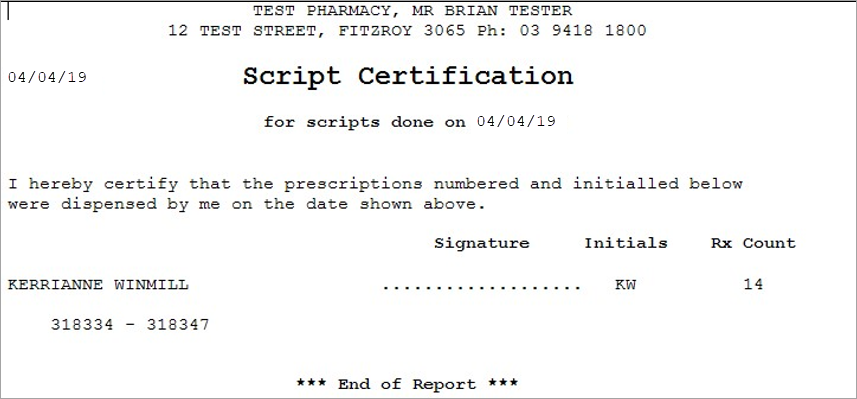
Certification Report
The Certification Report should be printed and signed by all pharmacists at the end of each dispensing day.
-
From the Reports menu, select Script, then Certification.
The Script Certification popup displays.
- Set the date required.
-
To run the report, select Generate or press [Enter].
Click the thumbnail below to see a larger image.
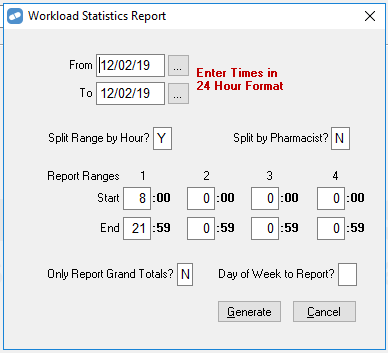
Workload Statistics Report
This report summarises the number of scripts dispensed per hour and per pharmacist (if required).
-
From the Reports menu, select Script, then Workload Statistics.
The Workload Statistics Report popup displays.
- Select the date range.
- For Split Range by Hour?, enter:
- Y to report on scripts dispensed per hour.
- N to report on ranges as set in Report Ranges.
- For Split by Pharmacist?, enter:
- Y to report scripts dispensed per pharmacist (per hour or other time range).
- N to report total scripts dispensed only.
-
For Report Ranges, set the time ranges to be reported on.
To report on the whole day, set the Start time to the opening time of the pharmacy, and set the End time to the closing time of the pharmacy. Use multiple ranges to compare different times of day eg pre lunch (9:00 -11:30), lunch(11:31 – 14:00) by setting the times required.
- For Report Grand Totals?, enter:
- Y to only print overall totals and not daily totals
- N to print daily totals as well.
- For Day of Week to Report, leave blank if you want to include each day in the report. Otherwise enter one of the following to specify a particular day of the week:
- 1 for Sunday.
- 2 for Monday.
- 3 for Tuesday.
- 4 for Wednesday .
- 5 for Thursday.
- 6 for Friday.
- 7 for Saturday.
-
To run the report, select Generate or press [Enter].
Click the thumbnail below to see a larger image.
